Minds On
The importance of climate patterns
Brainstorm
What is a climate?
That same person then asks about the climate patterns of Kingston, Ontario. Consider some possible reasons might they need that information. Complete the following 'My Notes' graphic organizer in your notebook or using the following fillable and printable document. If you would like, you can use speech-to-text or audio recording tools to record your thoughts.
Press 'Hint' to reveal some possible reasons.

A map of Ontario showing where Kingston is located. It is south of Ottawa, along the St. Lawrence River, and east of Lake Ontario.
Complete the Your Notes activity in your notebook or use the following fillable and printable document.
Press the ‘Activity’ button to access Your Notes.
Action
A way to analyse climate patterns
One way to represent the climate patterns of a particular location is using a climate graph.
There are two pieces of information shared on a climate graph. The precipitation levels (rainfall, snowfall, etc.) each month of the year are measured in millimetres and represented on a bar graph. The temperature, measured in degrees Celsius, is represented by a line graph, using the same axes as the bar graph.
The precipitation scale is on the left of the graph and the temperature scale is on the right of the graph.
The person who approached you in the Minds On activity, needing to know the climate patterns of Kingston, could refer to this graph to help them learn the average temperatures and precipitation levels per month over the course of a year.

This image shows a climate graph for the city of Kingston, Ontario. There are two pieces of information shared on a climate graph. The amount of precipitation (rainfall, snowfall, etc.) each month of the year is measured in mm and is represented on a bar graph, and the temperature, measured in ℃, is represented by a line graph, using the same axes as the bar graph. This climate graph shares this information about Kingston each month: January – average of 76mm of precipitation, average temperature of -7 ℃. February – average of 61mm of precipitation, average temperature of -6 ℃. March – average of 79mm of precipitation, average temperature of -1 ℃. April – average precipitation of 82mm, average temperature of 4 ℃. May – average precipitation of 77mm, average temperature of 12 ℃. June – average precipitation of 74mm, average temperature of 17 ℃. July – average precipitation of 58mm, average temperature of 21 ℃. August – average precipitation of 84mm, average temperature of 19 ℃. September – average precipitation of 92mm, average temperature of 15 ℃. October – average precipitation of 85mm, average temperature of 7 ℃. November – average precipitation of 95mm, average temperature of 3 ℃. December – average precipitation of 99mm, average temperature of -4 ℃.
What do you notice about this climate graph?
Think about the questions, then press each question to reveal the answers to them.
Some of the conclusions that can be drawn about Kingston, Ontario, based on its precipitation and average temperature are:
- The summers in Kingston have temperatures between 15 degrees and 21 degrees.
- Kingston has precipitation all year round.
- Kingston’s temperatures lie within a range of approximately 30 degrees.
Press 'Explanation' to reveal more information about these conclusions.
Reflecting on the data
Connections
Asking and answering questions

Choose two of the following questions about the data presented in this climate graph, then ask your own question:
- How different do you think a climate graph for another climate region might appear? Why?
Press 'Hint' to reveal some ideas.
- How might this information affect those who are thinking of moving to Kingston?
- How are the two measures in a climate graph related? Why do you think climate is measured by precipitation and temperature in a climate graph?
Press 'Hint' to reveal some ideas.
- What is one question you could ask to understand the patterns in the data?
Press 'Hint' to reveal some ideas.
Analysing climate graph data
The following climate graphs represent locations around the world with distinct climate patterns. What three conclusions can you draw about each of these graphs, similar to those for Kingston, ON?
Explore the images and climate data represented for these different locations and different climate regions around the world. The first is the Amazon Rainforest, the second is Amsterdam, Netherlands, and the third is the Sahara Desert.


This climate graph of the Amazon Rainforest shares this current data regarding precipitation levels (measured in mm) and average temperatures (measured in ℃): January: average precipitation of 260mm, average temperature of 26.1 ℃ February: average precipitation of 258mm, average temperature of 26.2 ℃ March: average precipitation of 300mm, average temperature of 26 ℃ April: average precipitation of 280mm, average temperature of 26.1 ℃ May: average precipitation of 205mm, average temperature of 26.3 ℃ June: average precipitation of 105mm, average temperature of 26.5 ℃ July: average precipitation of 70mm, average temperature of 26.7 ℃ August: average precipitation of 45mm, average temperature of 25.4 ℃ September: average precipitation of 70mm, average temperature of 27.4 ℃ October: average precipitation of 110mm, average temperature of 27.4 ℃ November: average precipitation of 160mm, average temperature of 27.2 ℃ December: average precipitation of 220mm, average temperature of 26.6 ℃

This climate graph of Amsterdam, in the Netherlands, shares this current data regarding precipitation levels (measured in mm) and average temperatures (measured in ℃): January: average precipitation of 55mm, average temperature of 5 ℃ February: average precipitation of 30mm, average temperature of 5 ℃ March: average precipitation of 55mm, average temperature of 6 ℃ April: average precipitation of 30mm, average temperature of 8 ℃ May: average precipitation of 45mm, average temperature of 13 ℃ June: average precipitation of 60mm, average temperature of 15 ℃ July: average precipitation of 58mm, average temperature of 16 ℃ August: average precipitation of 56mm, average temperature of 17 ℃ September: average precipitation of 75mm, average temperature of 15 ℃ October: average precipitation of 77mm, average temperature of 13 ℃ November: average precipitation of 80mm, average temperature of 6 ℃ December: average precipitation of 70mm, average temperature of 5 ℃

This climate graph of the Sahara Desert shares this current data regarding precipitation levels (measured in mm) and average temperatures (measured in ℃): January: average precipitation of 5mm, average temperature of 30 ℃ February: average precipitation of 5mm, average temperature of 32.5 ℃ March: average precipitation of 4mm, average temperature of 37 ℃ April: average precipitation of 2.7mm, average temperature of 38 ℃ May: average precipitation of 2.3mm, average temperature of 42 ℃ June: average precipitation of 0mm, average temperature of 40.5 ℃ July: average precipitation of 0mm, average temperature of 39 ℃ August: average precipitation of 1mm, average temperature of 37 ℃ September: average precipitation of 0mm, average temperature of 38 ℃ October: average precipitation of 2.7mm, average temperature of 39 ℃ November: average precipitation of 2.3mm, average temperature of 35 ℃ December: average precipitation of 6mm, average temperature of 30 ℃
Which climate regions do you think each of these locations are located, based on their climate patterns?
Select the correct answer.
Connections
Asking Questions
Choose one of the three climate graphs. Create two questions about the patterns noticed in the data. For example, in the dry months in Brazil, does it rain a little each day or less often?
Working with climate graphs
Option 1: Creating a climate graph
Choose one of the sets of data on monthly precipitation levels and temperature averages for either Reykjavik or San José to create your own climate graph.
You can use the activity space provided or a method of your choice to create your graph. For example, you can explore digital tutorials and use spreadsheets to create your own graphs.
Be ready to draw three conclusions about the data that is represented on your graph.
Press 'Hint ' to reveal some ideas.
Your graph should include:
Press 'San José' or 'Reykjavik' to access the data set for that location.
| Month | Precipitation (millimetres) | Temperature (degrees Celsius) |
|---|---|---|
| January | 160 | 24.4 |
| February | 100 | 24.8 |
| March | 100 | 25.8 |
| April | 170 | 26 |
| May | 300 | 25.7 |
| June | 380 | 24.8 |
| July | 370 | 24.9 |
| August | 380 | 24.8 |
| September | 385 | 24.6 |
| October | 410 | 24.3 |
| November | 280 | 24 |
| December | 200 | 23.9 |
This climate chart of the San José shares this current data regarding precipitation levels (measured in mm) and average temperatures (measured in degrees Celsius.): January: average precipitation of 160mm, average temperature of 24.4 ℃ February: average precipitation of 100 mm, average temperature of 24.8 ℃ March: average precipitation of 100 mm, average temperature of 25.8 ℃ April: average precipitation of 170 mm, average temperature of 26 ℃ May: average precipitation of 300 mm, average temperature of 25.7 ℃ June: average precipitation of 380 mm, average temperature of 24.8 ℃ July: average precipitation of 370 mm, average temperature of 24.9 ℃ August: average precipitation of 380 mm, average temperature of 24.3 ℃ September: average precipitation of 385 mm, average temperature of 24.8 ℃ October: average precipitation of 410 mm, average temperature of 24.8 ℃ November: average precipitation of 280 mm, average temperature of 24.8 ℃ December: average precipitation of 200 mm, average temperature of 23.9 ℃
| Month | Precipitation (millimetres) | Temperature (degrees Celsius) |
|---|---|---|
| January | 76 | 2.5 |
| February | 72 | 4.1 |
| March | 82 | 4 |
| April | 58 | 6 |
| May | 46 | 8 |
| June | 50 | 12 |
| July | 52 | 12.5 |
| August | 62 | 13 |
| September | 68 | 10 |
| October | 86 | 7 |
| November | 72 | 3 |
| December | 79 | 2.5 |
This climate chart of the Reykjavik, Iceland shares this current data regarding precipitation levels (measured in mm) and average temperatures (measured in ℃): January: average precipitation of 76 mm, average temperature of 2.5 ℃ February: average precipitation of 72 mm, average temperature of 4.1 ℃ March: average precipitation of 82 mm, average temperature of 4 ℃ April: average precipitation of 58 mm, average temperature of 6 ℃ May: average precipitation of 46 mm, average temperature of 8 ℃ June: average precipitation of 50 mm, average temperature of 12 ℃ July: average precipitation of 52 mm, average temperature of 12.5 ℃ August: average precipitation of 62 mm, average temperature of 13 ℃ September: average precipitation of 68 mm, average temperature of 10 ℃ October: average precipitation of 86 mm, average temperature of 7 ℃ November: average precipitation of 72 mm, average temperature of 3 ℃ December: average precipitation of 79 mm, average temperature of 2.5 ℃
You may complete the task by using electronic graphing software, graph paper in your notebook, or the following printable document.

After you complete the task, click on the title of the locations to reveal the answers.

This climate graph of the San José, Costa Rica shares this current data regarding precipitation levels (measured in mm) and average temperatures (measured in ℃): January: average precipitation of 160mm, average temperature of 24.4 ℃ February: average precipitation of 100 mm, average temperature of 24.8 ℃ March: average precipitation of 100 mm, average temperature of 25.8 ℃ April: average precipitation of 170 mm, average temperature of 26 ℃ May: average precipitation of 300 mm, average temperature of 25.7 ℃ June: average precipitation of 380 mm, average temperature of 24.8 ℃ July: average precipitation of 370 mm, average temperature of 24.9 ℃ August: average precipitation of 380 mm, average temperature of 24.3 ℃ September: average precipitation of 385 mm, average temperature of 24.8 ℃ October: average precipitation of 410 mm, average temperature of 24.8 ℃ November: average precipitation of 280 mm, average temperature of 24.8 ℃ December: average precipitation of 200 mm, average temperature of 23.9 ℃

This climate graph of the Reykjavik, Iceland shares this current data regarding precipitation levels (measured in mm) and average temperatures (measured in ℃): January: average precipitation of 76 mm, average temperature of 2.5 ℃ February: average precipitation of 72 mm, average temperature of 4.1 ℃ March: average precipitation of 82 mm, average temperature of 4 ℃ April: average precipitation of 58 mm, average temperature of 6 ℃ May: average precipitation of 46 mm, average temperature of 8 ℃ June: average precipitation of 50 mm, average temperature of 12 ℃ July: average precipitation of 52 mm, average temperature of 12.5 ℃ August: average precipitation of 62 mm, average temperature of 13 ℃ September: average precipitation of 68 mm, average temperature of 10 ℃ October: average precipitation of 86 mm, average temperature of 7 ℃ November: average precipitation of 72 mm, average temperature of 3 ℃ December: average precipitation of 79 mm, average temperature of 2.5 ℃
You may complete the task by using this interactive activity. Use this interactive activity to create a graph that uses the average temperature data.
Well done! Now, use this interactive activity to create a graph that uses the average precipitation data.
Option 2: Describing the trends from data
Choose one of the sets of data on monthly precipitation levels and temperature averages from the options of locations and describe the patterns and trends that appear in the data.
For example, the Sahara Desert monthly precipitation levels were always 5mm or less. The levels were higher in the months of November to February, trending down, with very little to no precipitation in the months of June to September.
Record your patterns and trends in a method of your choice.
Draw three conclusions about the data that is represented on your graph.
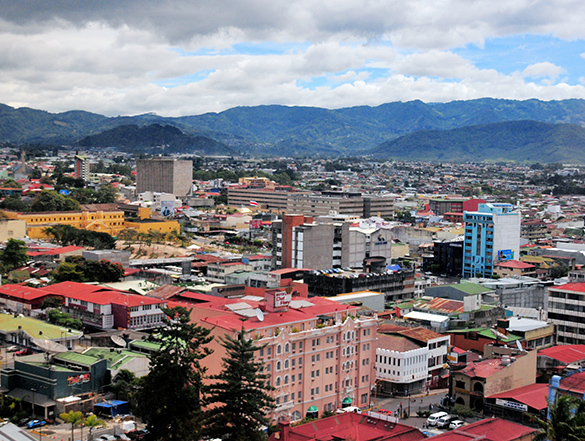
This is a data set presented about the climate in San José, Costa Rica and includes the months of the year, precipitation levels per month, measured in millimetres, and average temperatures per month, measured in degrees Celsius.
| Month | Precipitation (mm) | Temperature (℃) |
|---|---|---|
| January | 160 | 24.4 |
| February | 100 | 24.8 |
| March | 100 | 25.8 |
| April | 170 | 26 |
| May | 300 | 25.7 |
| June | 380 | 24.8 |
| July | 370 | 24.9 |
| August | 380 | 24.8 |
| September | 385 | 24.6 |
| October | 410 | 24.3 |
| November | 280 | 24 |
| December | 200 | 23.9 |
This climate chart of the San José, Costa Rica shares this current data regarding precipitation levels (measured in mm) and average temperatures (measured in ℃): January: average precipitation of 160mm, average temperature of 24.4 ℃ February: average precipitation of 100 mm, average temperature of 24.8 ℃ March: average precipitation of 100 mm, average temperature of 25.8 ℃ April: average precipitation of 170 mm, average temperature of 26 ℃ May: average precipitation of 300 mm, average temperature of 25.7 ℃ June: average precipitation of 380 mm, average temperature of 24.8 ℃ July: average precipitation of 370 mm, average temperature of 24.9 ℃ August: average precipitation of 380 mm, average temperature of 24.3 ℃ September: average precipitation of 385 mm, average temperature of 24.8 ℃ October: average precipitation of 410 mm, average temperature of 24.8 ℃ November: average precipitation of 280 mm, average temperature of 24.8 ℃ December: average precipitation of 200 mm, average temperature of 23.9 ℃
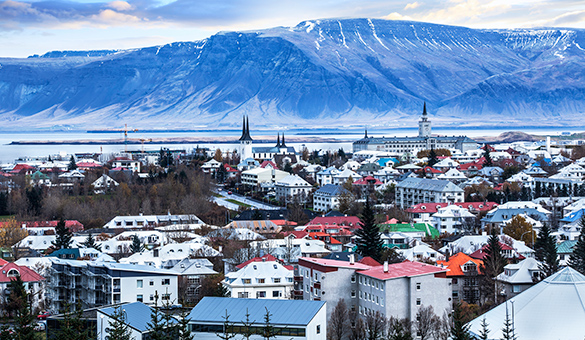
This is a data set presented for Reykjavik, Iceland and includes the months of the year, precipitation levels per month, measured in millimetre, and average temperatures per month, measured in degrees Celsius.
| Month | Precipitation (mm) | Temperature (℃) |
|---|---|---|
| January | 76 | 2.5 |
| February | 72 | 4.1 |
| March | 82 | 4 |
| April | 58 | 6 |
| May | 46 | 8 |
| June | 50 | 12 |
| July | 52 | 12.5 |
| August | 62 | 13 |
| September | 68 | 10 |
| October | 86 | 7 |
| November | 72 | 3 |
| December | 79 | 2.5 |
This climate chart of the Reykjavik, Iceland shares this current data regarding precipitation levels (measured in mm) and average temperatures (measured in ℃): January: average precipitation of 76 mm, average temperature of 2.5 ℃ February: average precipitation of 72 mm, average temperature of 4.1 ℃ March: average precipitation of 82 mm, average temperature of 4 ℃ April: average precipitation of 58 mm, average temperature of 6 ℃ May: average precipitation of 46 mm, average temperature of 8 ℃ June: average precipitation of 50 mm, average temperature of 12 ℃ July: average precipitation of 52 mm, average temperature of 12.5 ℃ August: average precipitation of 62 mm, average temperature of 13 ℃ September: average precipitation of 68 mm, average temperature of 10 ℃ October: average precipitation of 86 mm, average temperature of 7 ℃ November: average precipitation of 72 mm, average temperature of 3 ℃ December: average precipitation of 79 mm, average temperature of 2.5 ℃
Consolidation
What do climate graphs teach us about a location?

You have analysed and created or described patterns and trends represented by data shared about monthly precipitation levels and monthly average temperatures of different climate regions around the world.
Connections
Connections
Choose one of the following climate regions and reflect on your analysis. Record your responses in a method of your choice.
Note: If you would like, you could find new locations in the world that are a part of the climate region to analysed instead of using the locations listed.
Tropical climate regions
Based on your analysis of the Amazon Rainforest and San José, Costa Rica:
- What conclusions can you draw about precipitation levels and temperatures of a tropical climate region?
- Does this analysis tell us any other climate information about this climate region?
- Are there any patterns that you notice in these climate graphs?

This climate graph of the Amazon Rainforest shares this current data regarding precipitation levels (measured in mm) and average temperatures (measured in ℃): January: average precipitation of 260mm, average temperature of 26.1 ℃ February: average precipitation of 258mm, average temperature of 26.2 ℃ March: average precipitation of 300mm, average temperature of 26 ℃ April: average precipitation of 280mm, average temperature of 26.1 ℃ May:verage precipitation of 205mm, average temperature of 26.3 ℃ June: average precipitation of 105mm, average temperature of 26.5 ℃ July: average precipitation of 70mm, average temperature of 26.7 ℃ August: average precipitation of 45mm, average temperature of 25.4 ℃ September: average precipitation of 70mm, average temperature of 27.4 ℃ October: average precipitation of 110mm, average temperature of 27.4 ℃ November: average precipitation of 160mm, average temperature of 27.2 ℃ December: average precipitation of 220mm, average temperature of 26.6 ℃

This climate chart of the San José, Costa Rica shares this current data regarding precipitation levels (measured in mm) and average temperatures (measured in ℃): January: average precipitation of 160mm, average temperature of 24.4 ℃ February: average precipitation of 100 mm, average temperature of 24.8 ℃ March: average precipitation of 100 mm, average temperature of 25.8 ℃ April: average precipitation of 170 mm, average temperature of 26 ℃ May: average precipitation of 300 mm, average temperature of 25.7 ℃ June: average precipitation of 380 mm, average temperature of 24.8 ℃ July: average precipitation of 370 mm, average temperature of 24.9 ℃ August: average precipitation of 380 mm, average temperature of 24.3 ℃ September: average precipitation of 385 mm, average temperature of 24.8 ℃ October: average precipitation of 410 mm, average temperature of 24.8 ℃ November: average precipitation of 280 mm, average temperature of 24.8 ℃ December: average precipitation of 200 mm, average temperature of 23.9 ℃
Dry climate regions
Based on your analysis of the Sahara Desert:
- What conclusions can you draw about precipitation levels and temperatures of a dry climate region?
- Does this analysis tell us any other climate information about this climate region?
- Are there any patterns that you notice in these climate graphs?

This climate graph of the Sahara Desert shares this current data regarding precipitation levels (measured in mm) and average temperatures (measured in ℃): January: average precipitation of 5mm, average temperature of 30 ℃ February: average precipitation of 5mm, average temperature of 32.5 ℃ March: average precipitation of 4mm, average temperature of 37 ℃ April: average precipitation of 2.7mm, average temperature of 38 ℃ May: average precipitation of 2.3mm, average temperature of 42 ℃ June: average precipitation of 0mm, average temperature of 40.5 ℃ July: average precipitation of 0mm, average temperature of 39 ℃ August: average precipitation of 1mm, average temperature of 37 ℃ September: average precipitation of 0mm, average temperature of 38 ℃ October: average precipitation of 2.7mm, average temperature of 39 ℃ November: average precipitation of 2.3mm, average temperature of 35 ℃ December: average precipitation of 6mm, average temperature of 30 ℃
Temperate climate regions
Based on your analysis of Amsterdam and Reykjavik:
- What conclusions can you draw about precipitation levels and temperatures of a temperate climate region?
- Does this analysis tell us any other climate information about this climate region?
- Are there any patterns that you notice in these climate graphs?

This climate graph of Amsterdam, in the Netherlands, shares this current data regarding precipitation levels (measured in mm) and average temperatures (measured in ℃): January: average precipitation of 55mm, average temperature of 5 ℃ February: average precipitation of 30mm, average temperature of 5 ℃ March: average precipitation of 55mm, average temperature of 6 ℃ April: average precipitation of 30mm, average temperature of 8 ℃ May: average precipitation of 45mm, average temperature of 13 ℃ June: average precipitation of 60mm, average temperature of 15 ℃ July: average precipitation of 58mm, average temperature of 16 ℃ August: average precipitation of 56mm, average temperature of 17 ℃ September: average precipitation of 75mm, average temperature of 15 ℃ October: average precipitation of 77mm, average temperature of 13 ℃ November: average precipitation of 80mm, average temperature of 6 ℃ December: average precipitation of 70mm, average temperature of 5 ℃

This climate graph of the Reykjavik, Iceland shares this current data regarding precipitation levels (measured in mm) and average temperatures (measured in ℃): January: average precipitation of 76 mm, average temperature of 2.5 ℃ February: average precipitation of 72 mm, average temperature of 4.1 ℃ March: average precipitation of 82 mm, average temperature of 4 ℃ April: average precipitation of 58 mm, average temperature of 6 ℃ May: average precipitation of 46 mm, average temperature of 8 ℃ June: average precipitation of 50 mm, average temperature of 12 ℃ July: average precipitation of 52 mm, average temperature of 12.5 ℃ August: average precipitation of 62 mm, average temperature of 13 ℃ September: average precipitation of 68 mm, average temperature of 10 ℃ October: average precipitation of 86 mm, average temperature of 7 ℃ November: average precipitation of 72 mm, average temperature of 3 ℃ December: average precipitation of 79 mm, average temperature of 2.5 ℃
Reflection
As you read the following descriptions, select the one that best describes your current understanding of the learning in this activity. Press the corresponding button once you have made your choice.
I feel...
Now, expand on your ideas by recording your thoughts using a voice recorder, speech-to-text, or writing tool.
When you review your notes on this learning activity later, reflect on whether you would select a different description based on your further review of the material in this learning activity.