Minds On
Task 1: Rural vs. urban
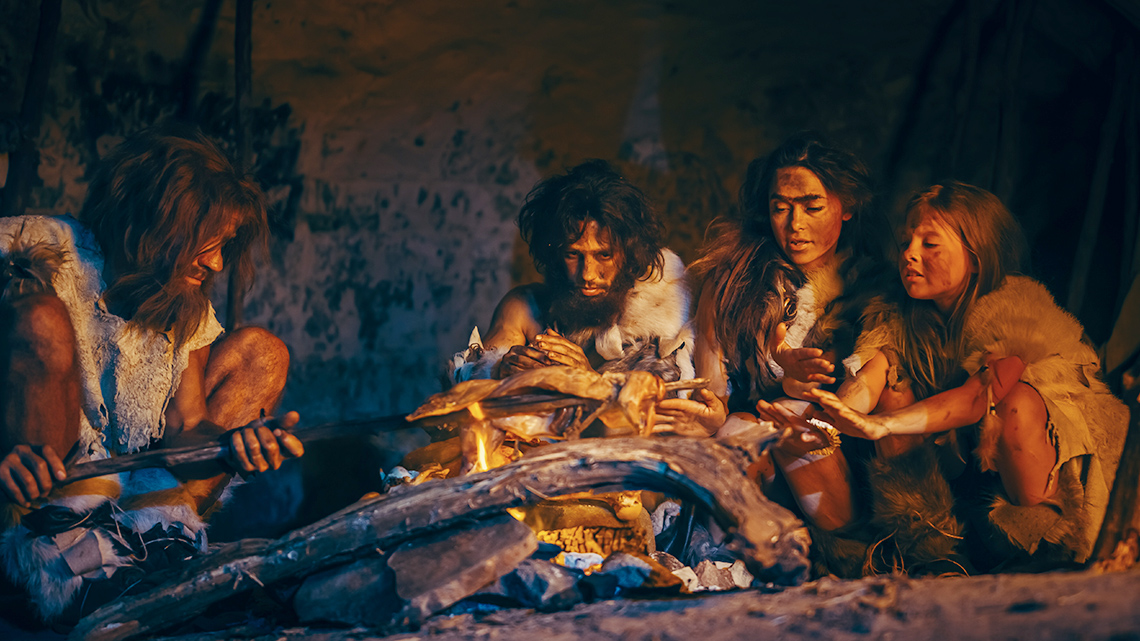
Imagine a home in the country versus a home in the city. What are some differences?
Brainstorm a list of differences you might notice between country and city homes.
Explore the following images to help inspire you.
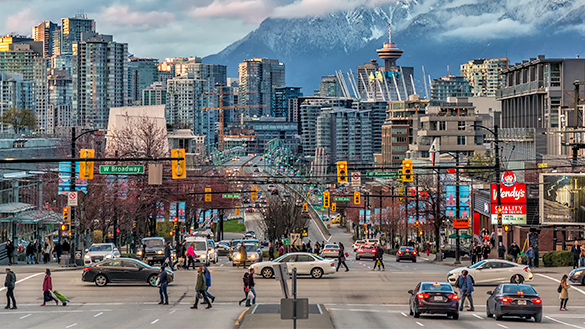
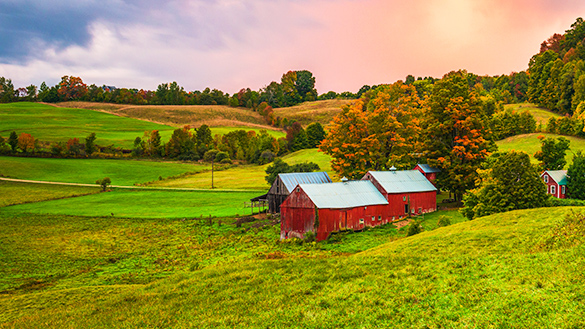
Complete the Country Versus City Homes activity in your notebook or use the following fillable and printable document. You can also use another method of your choice.
| A home in the country | A home in the city |
|---|---|
Press the ‘Activity’ button to access Country Versus City Homes.
Task 2: Settlement trends
An urban settlement is a place with a dense amount of people, such as a city.
A rural settlement is a place with a sparse populations of people, such as those found in the country.
Explore the following series of graphs that portray the change between urban (city) and rural (country) populations. What do you notice?
Record your observations and ideas in a notebook or another method of your choice.

This graph has a title of “Number of people living in urban and rural areas, Canada, 1960 to 2017.” The y-axis (the vertical side on the left) lists the population in millions from 0 to 25 million, in 5 million intervals. The x-axis (the horizontal side at the bottom) lists the years, starting at 1960 to 2010 in 10-year intervals and then ending at 2017. There is a blue line that represents “urban population.” It begins at approximately 12 million in 1960, to 16 million in 1970, to 19 million in 1980, to 21 million in 1990 to 24 million in 2000, to 27 million in 2010 and then off the chart, estimated 30 million in 2017.
There is a red line that represents rural population growth over time. It begins approximately at 6 million in 1960, to 5 million in 1970, to 7 million in 1980, to 8 million in 1990, to 7 million in 2000, and staying around 7 million for 2010 and 2017.

The graph has a title of “Number of people living in urban and rural areas, United States, 1960 to 2017.” The y-axis (the vertical side on the left) lists the population in millions from 0 to 250 million in 50 million intervals. The x-axis (the horizontal side at the bottom) lists the years, starting at 1960 to 2010 in 10-year intervals and then ending at 2017. There is a blue line that represents “urban population.” It begins at approximately 125 million in 1960, to 150 million in 1970, to 160 million in 1980, to 180 million in 1990 to 210 million in 2000, to 250 million in 2010 and then off the chart, estimated 260 million in 2017.
There is a red line that represents rural population growth over time. It begins approximately at 51 million in 1960 and 1970, to 55 million in 1980 and 1990, to 51 million 2000, and staying around 52 million for 2010 and 2017.

This graph has a titled of “Number of people living in urban and rural areas, China, 1960 to 2017.” The y-axis (the vertical side on the left) lists the population in millions from 0 to 800 million in 100 million intervals. The x-axis (the horizontal side on the bottom) lists the years, starting at 1960 to 2010 in 10-year intervals and then ending at 2017. There is a blue line that represents “urban population.” It begins at approximately 110 million in 1960, to 140 million in 1970, to 195 million in 1980, to 300 million in 1990 to 450 million in 2000, to 680 million in 2010 and then 800 million in 2017.
There is a red line that represents rural population growth over time. It begins approximately at 580 million in 1960, to 700 million in 1970, to 800 million in 1980, to 850 million in 1990, to 800 million 2000, then drops significantly to 680 million in 2010 and down again to 590 million in 2017. The red and blue line intersect each other in 2010 at approximately 680 million.

This graph is titled of “Number of people living in urban and rural areas, South Africa, 1960 to 2017.” The y-axis (the vertical side on the left) lists the population in millions from 0 to 35 million in 5 million intervals. The x-axis (the horizontal side at the bottom) lists the years, starting at 1960 to 2010 in 10-year intervals and then ending at 2017. There is a blue line that represents “urban population.” It begins at approximately 8 million in 1960, to 11 million in 1970, to 14 million in 1980, to 19 million in 1990 to 26 million in 2000, to 33 million in 2010 and then off the chart, estimated 37 million in 2017.
There is a red line that represents rural population growth over time. It begins approximately at 8 million in 1960, to 12 million in 1970, to 14 million in 1980, to 18 million in 1990, to 20 million in 2000 and hovers slightly below 20 million for 2010 and 2017.
Source: Our World in Data, 2021
Action
Task 1: Urbanization

People rarely live in isolation. Instead, they live in clusters that range from small villages to megacities. The organized groupings of humans are often focused on specific aspects of human life, such as: economic activity, transportation, communication, politics, education, culture, and environment.
Brainstorm
What do you think?
As people continued to move from rural settlements in the country to larger cities, what challenges or issues do you predict may have occurred? Why do you think this?
In the 1950s, approximately 30 percent of the world’s population lived in urban cities, while the remainder lived rurally. In 2007, this number jumped to just under 50% and again in 2018 up to 55%. This upward trend of urbanization is expected to continue, with approximately 68 percent of the world’s population living in urban cities by 2050.
Push and pull factors
There are different reasons that cause rural to urban migration – they are called push and pull factors.
In a migration theory, push factors are the social, political, economic, and environmental forces that drive people from their previous locations to search for new ones.
Pull factors are the social, political, economic, and environmental attractions of new areas that draw people away from their previous locations.
Urban migration
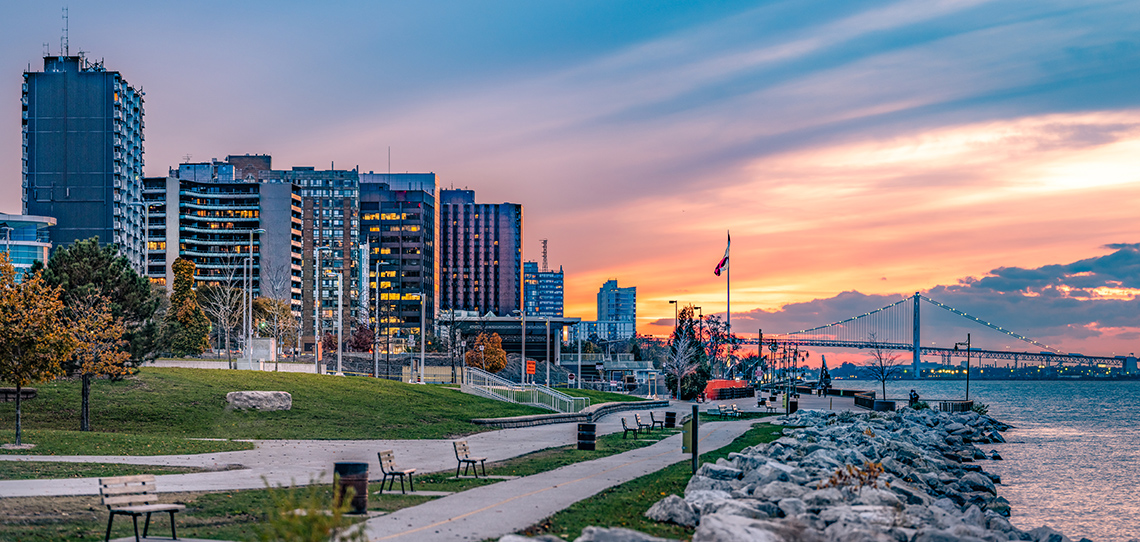
People often move to cities due to unemployment and low wages in rural areas, as well as a lack of access to land and assets. Some people choose to migrate to cities to gain better access to healthcare, education, and infrastructure.
The modernization of farming causes less of a demand for labour in the agricultural sector. Additional factors such as drought, natural disasters, or famine, may also push people towards urban areas.
Moving to urban areas often offers protection from conflict and families being able to reunite. Create a list of push and pull factors of rural to urban migration. Use examples from your own research, and what you previous explored through the learning activity.
Complete the Urban Migration Push and Pull Factors in your notebook or using the following fillable and printable document. You can also use another method of your choice.
| Push Factors (Reasons people are pushed out of rural areas) | Pull Factors (Reasons people are drawn to urban areas) |
|---|---|
Press the ‘Activity’ button to access Urban Migration Push and Pull Factors.
Reviewing definitions
Let’s review the key words and definitions that you have explored in the previous sections. For each word, select the corresponding definition.
Task 2: Impacts of urbanization
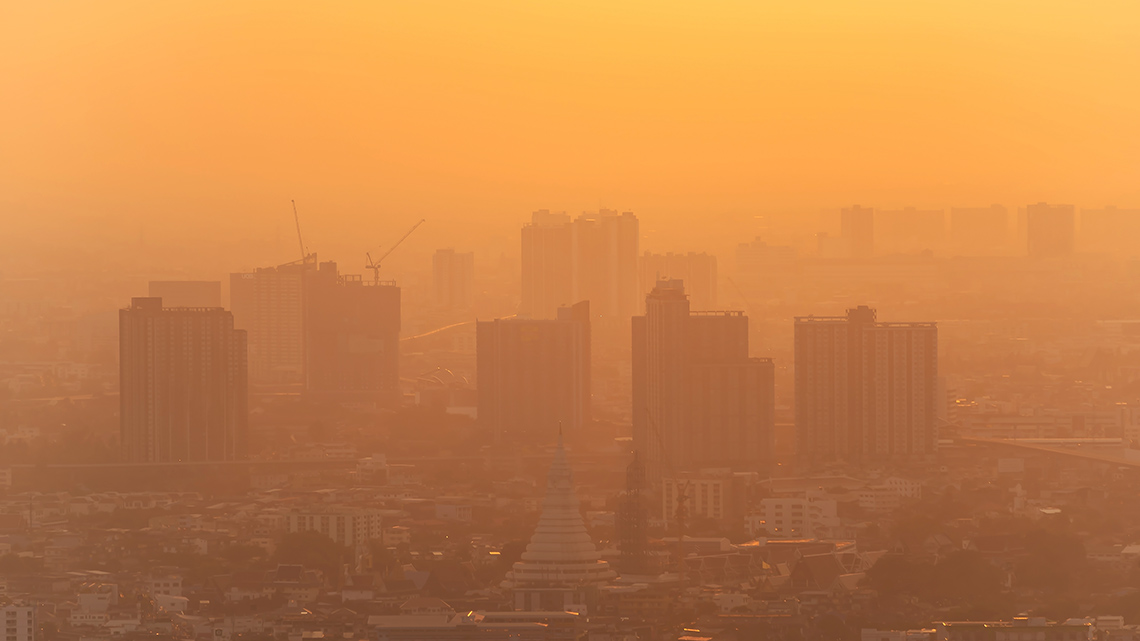
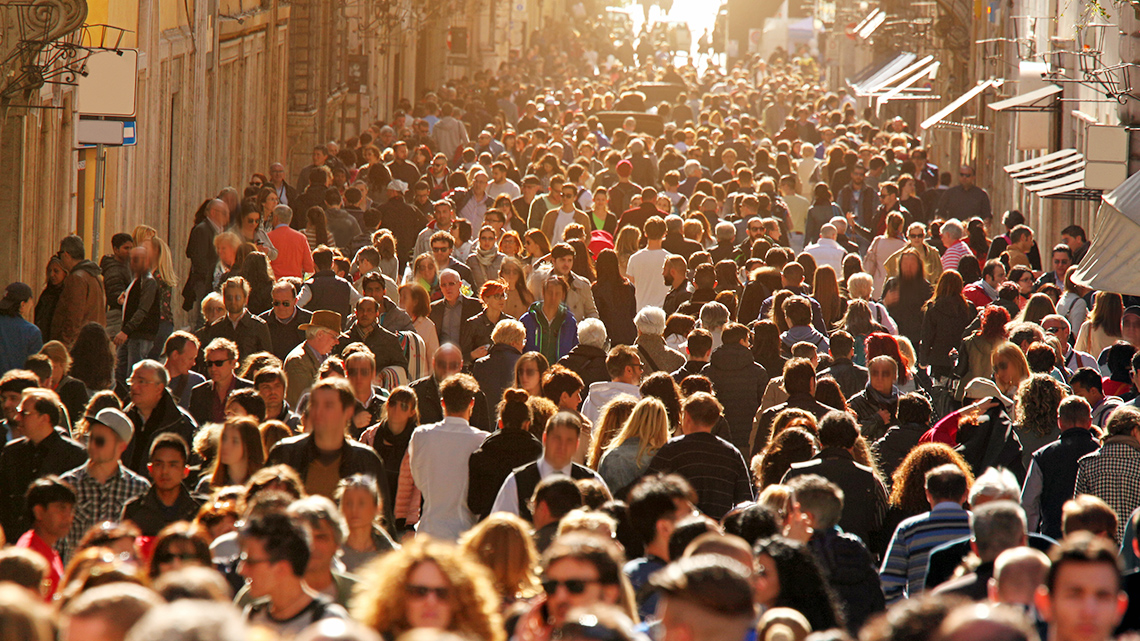
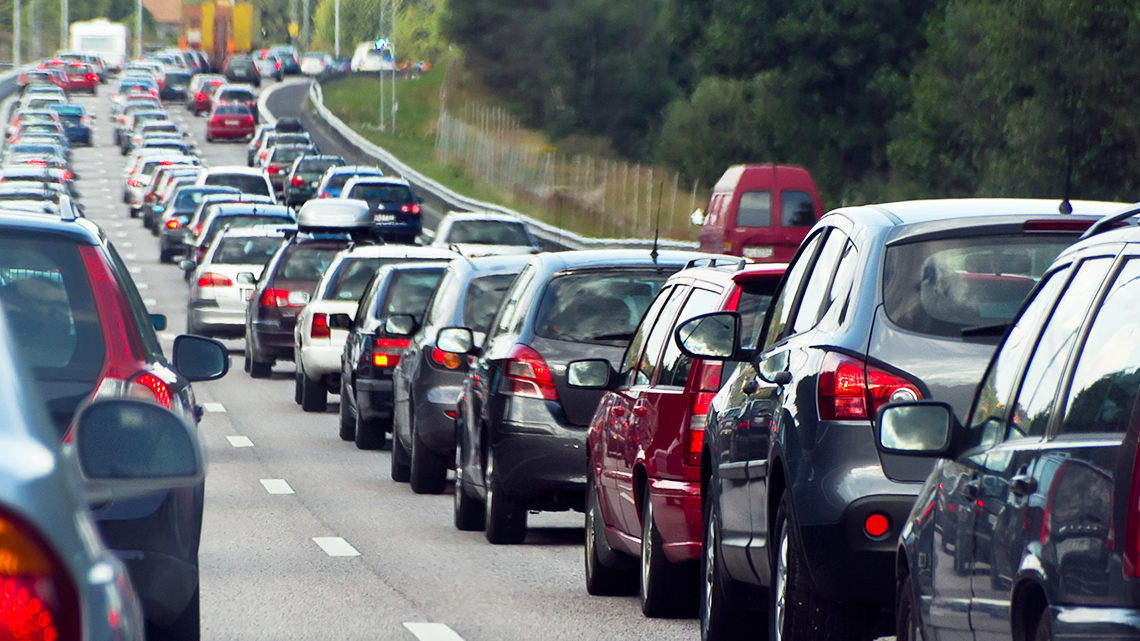
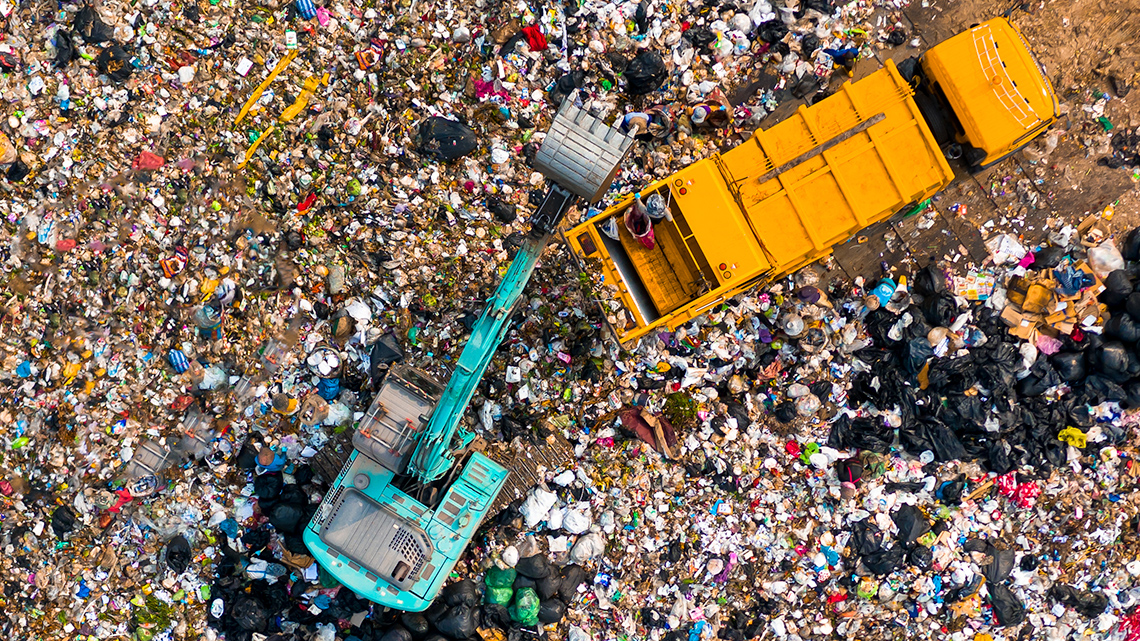
While the promise of jobs and prosperity pull people to migrate to cities, the increased migration also creates pressing problems that big cities face. Explore the following images.
- What problems can you predict urbanization causes?
- What are the impacts?
Record your ideas in a notebook or another method of your choice.
The process of inquiry
Explore the following five steps of inquiry. In the next activity, you will choose one impact of urbanization to investigate further with the inquiry process.
Inquiry is a multi-step process used to formulate questions, gather, organize, and analyse information, evaluate and draw conclusions, and communicate results.
Although the stages are not always done in the same order, the following diagram provides a summary of each step of inquiry.
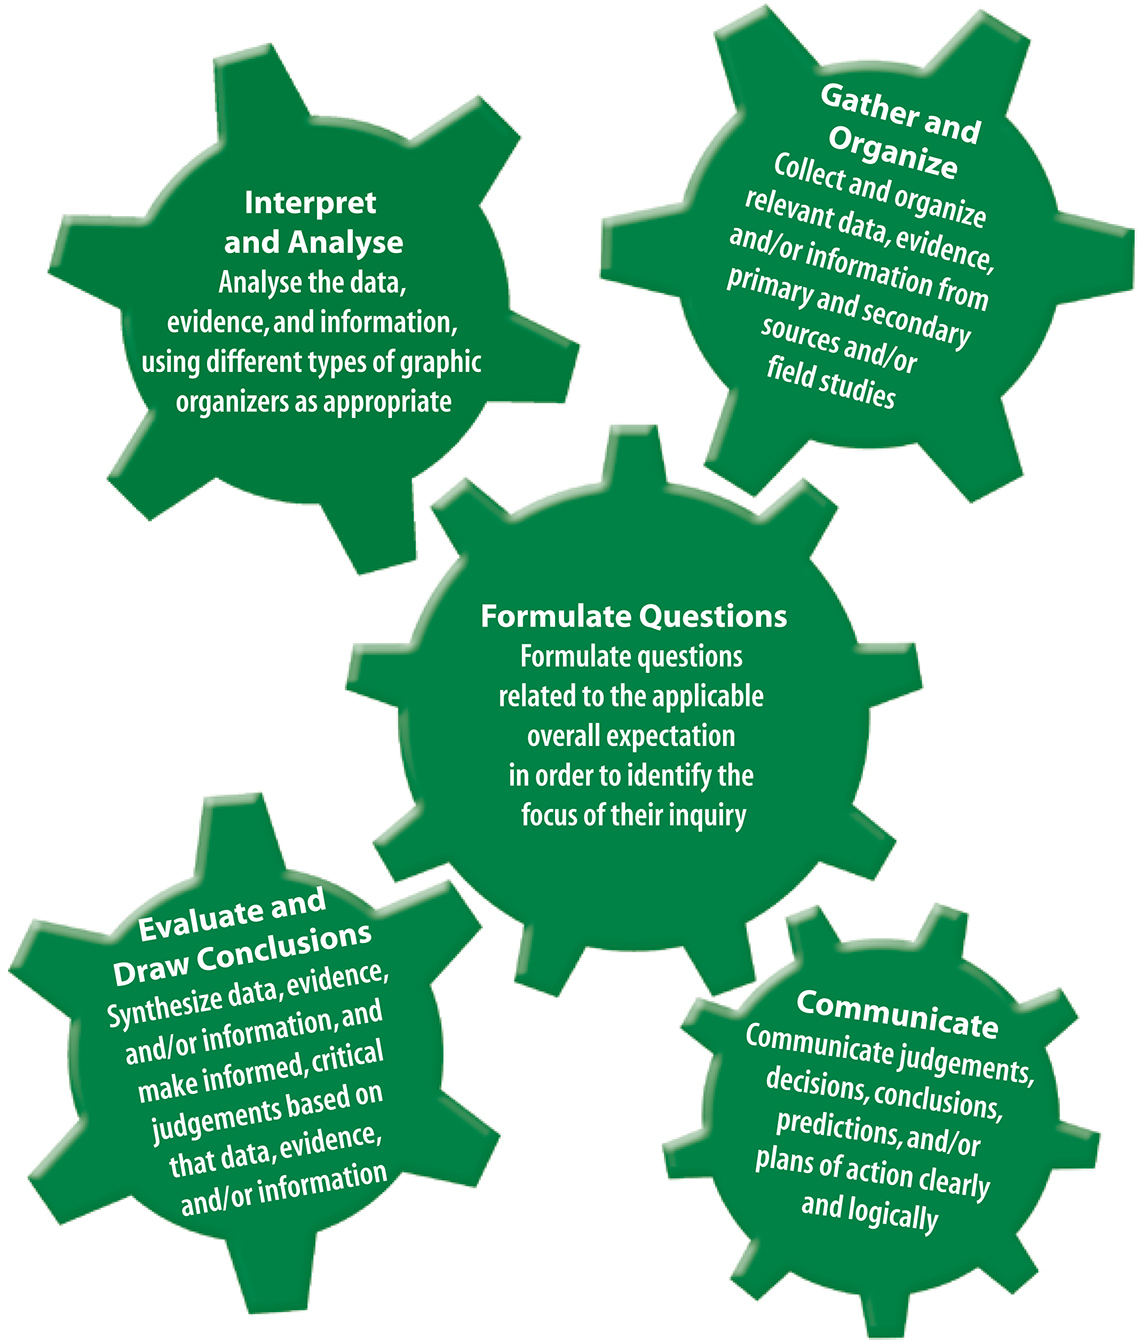
The Inquiry Process
Gather and Organize: Collect and organize relevant data, evidence, and/or information from primary and secondary sources and/or field studies
Interpret and Analyse: Analyse the data, evidence, and information, using different types of graphic organizers as appropriate
Formulate Questions: Formulate questions related to the applicable overall expectation in order to identify the focus of their inquiry
Evaluate and Draw Conclusions: synthesize data, evidence, and/or information, and make informed, critical judgements based on that data, evidence, and/or information
Communicate: communicate judgements, decisions, conclusions, predictions, and/or plans of action clearly and logically
Check out this audio clip entitled The Inquiry Process to outline the 5 steps of inquiry.
Press the ‘Play’ symbol to access the following audio recording.
The Inquiry Process
Choose one of the following impacts of urbanization to further investigate following the inquiry process.
Environmental Impacts
Health Impacts
| Formulate questions related to the topic: What do you want to know about this topic? What do you know about your topic already? What do I need to know? What is the focus? | |
|---|---|
| Gather information about the topic using a variety of resources: What kinds of resources would be helpful? Consider if information is valid and accurate. | |
| Interpret and analyze How does this information relate to my topic? How does it answer questions asked? Does it raise new questions? | |
| Evaluate and draw conclusions Make informed and critical judgments about your evidence to help you answer your questions. | |
| Communicate your findings in an appropriate way (possible choices could be: visual presentation, series of diary entries, video, speech, etc.). Who is your audience? What is important? What else can I connect my information with? How will I express my message? |
Complete the following Urbanization Impacts activity in your notebook or use the fillable and printable document. You can also use another method of your choice.
Press the ‘Activity’ button to access Urbanization Impacts.
Task 3: Case study – Kobe, Japan
As people continue to rapidly move from rural to urban areas, cities are forced to find inventive ways to manage urbanization. Some cities have begun to examine artificial islands to manage their population and mitigate the environmental impacts of urbanization.
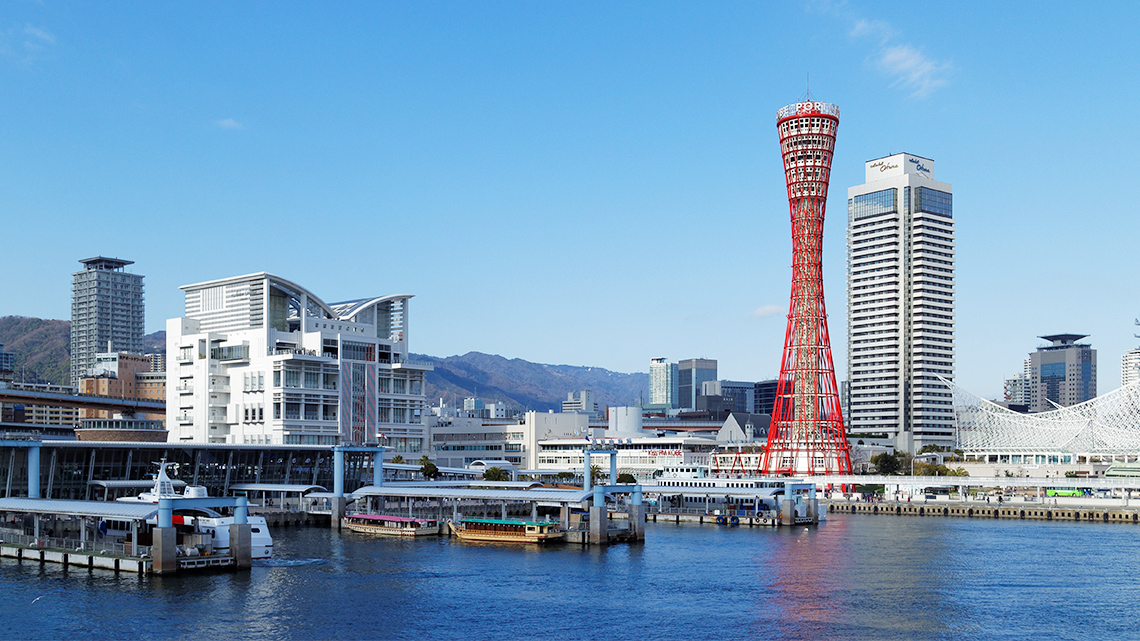
With a population over 1.4 million, Kobe, Japan, has a huge land shortage problem. This made the idea of building huge islands just off the coast more sensible.
Port Island is a 1,076-acre island development designed to provide land for housing, government offices, and port facilities.
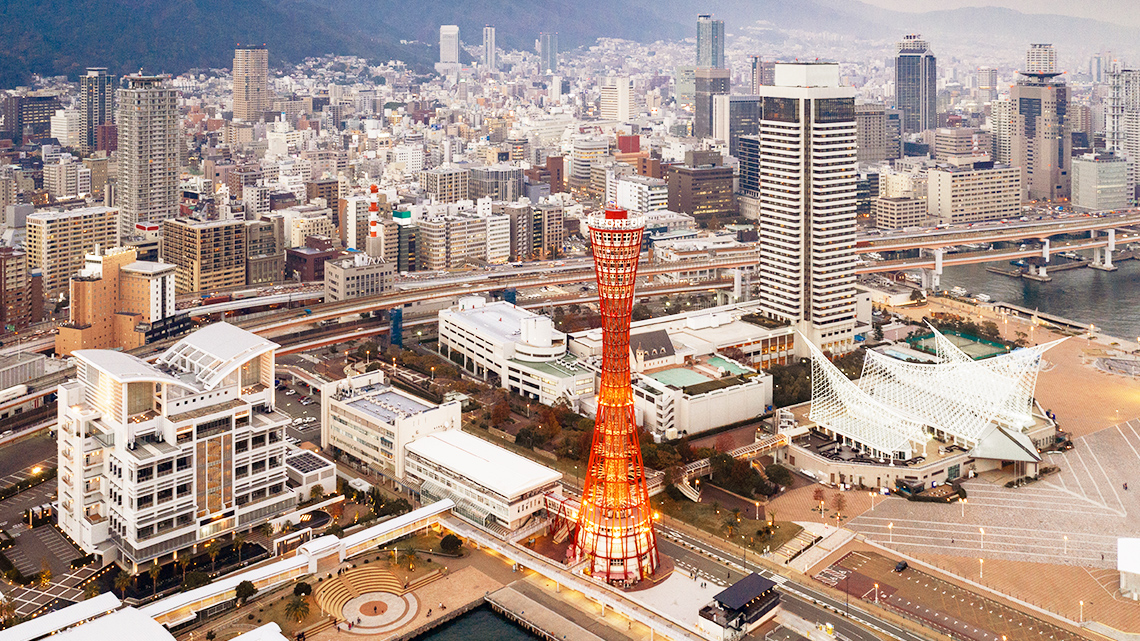
With urban populations continuing to soar, cities need alternative options to manage overcrowding. Islands made by people offer an alternative to building higher buildings or further inland cities.
Brainstorm
What do you think?
How did Kobe, Japan begin to solve its population problem?
Do you think it was a good solution? Why or why not?
Press ‘Hint’ to consider the following ideas.
Record your ideas in a notebook or a method of your choice.
Consolidation
Task 1: Call to action
In previous sections of this learning activity, you have explored how human settlement trends have developed and changed over time, including the increased move from rural to urban settlements. You have also independently investigated the environmental and health impacts of urbanization. It’s time to educate your community about what you’ve learned.

Create an infographic about urbanization including the positive and negative impacts. An infographic explores ways of sharing information by using images. The following carousel explores several ways to design an infographic, or you can use your own design ideas!
Provide your audience with a “call to action” – what can they do to help minimize the impacts of urbanization?
Press ‘Hint’ to access possible calls to action to consider!
Use the following checklist as a guide.
My ‘Urbanization Infographic’ includes…
Explore the following samples of infographics for inspiration or use your own design idea!
Task 2: Push for rural immigration
Explore this video entitled "Encouraging Rural Immigration" to learn more about push for rural immigration.
- Why did this family choose to leave the urban city for a rural community?
- Why is it important to have a balance of urban and rural settlement?
Record your ideas in a notebook or another method of your choice.
Reflection
As you read the following descriptions, select the one that best describes your current understanding of the learning in this activity. Press the corresponding button once you have made your choice.
I feel...
Now, expand on your ideas by recording your thoughts using a voice recorder, speech-to-text, or writing tool.
When you review your notes on this learning activity later, reflect on whether you would select a different description based on your further review of the material in this learning activity.
