Minds On
Task 1: Impacts
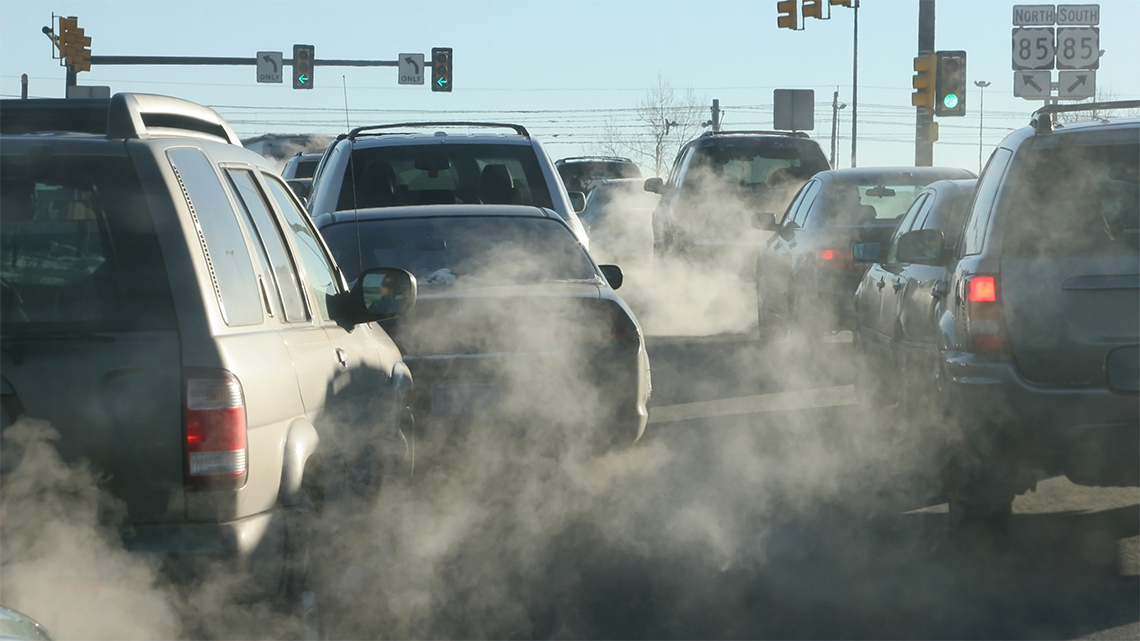
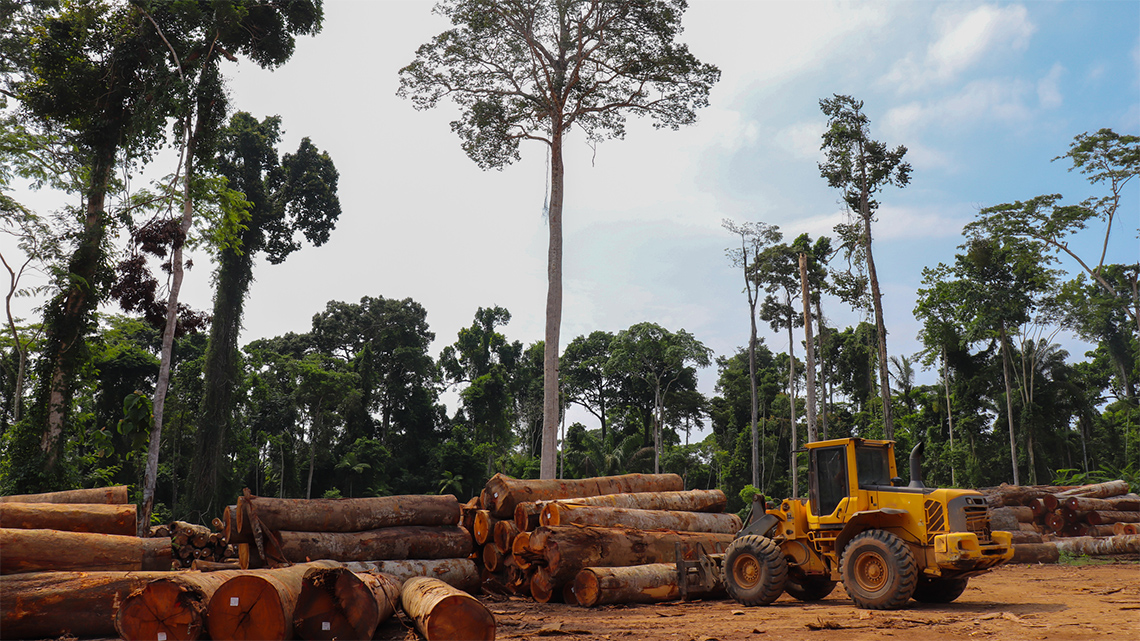
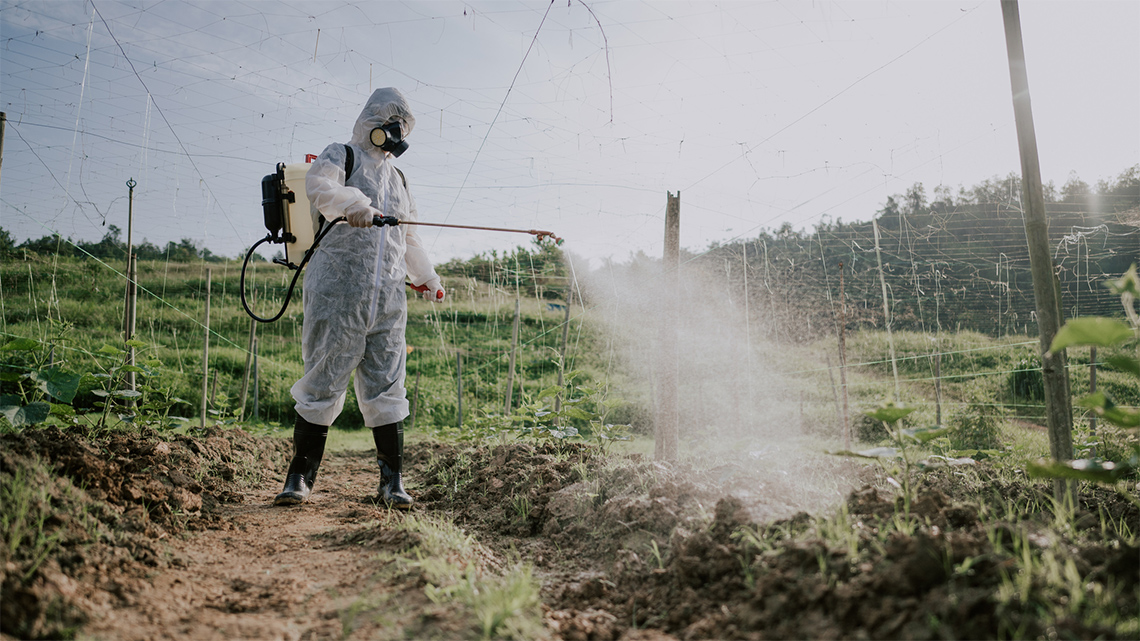
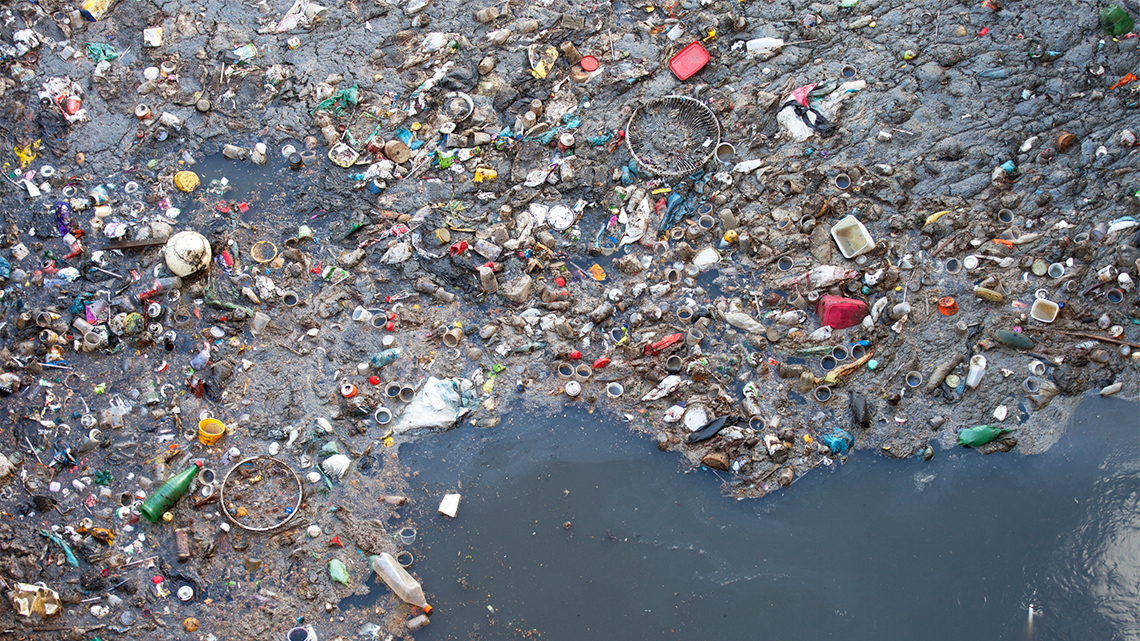
Examine the following series of images.
What impacts do you think these processes are having on the environment?
Once you have explored each image, record your responses in a notebook or the following organizer.
Complete the Impacts activity in your notebook or using the following fillable and printable document. You can also use another method of your choice.
| Processes | Environmental Impacts |
|---|---|
| Air Pollution | |
| Logging | |
| Agriculture | |
| Urbanization | |
| Garbage Disposal |
Press the ‘Activity’ button to access Impacts.
Task 2: Climate change?
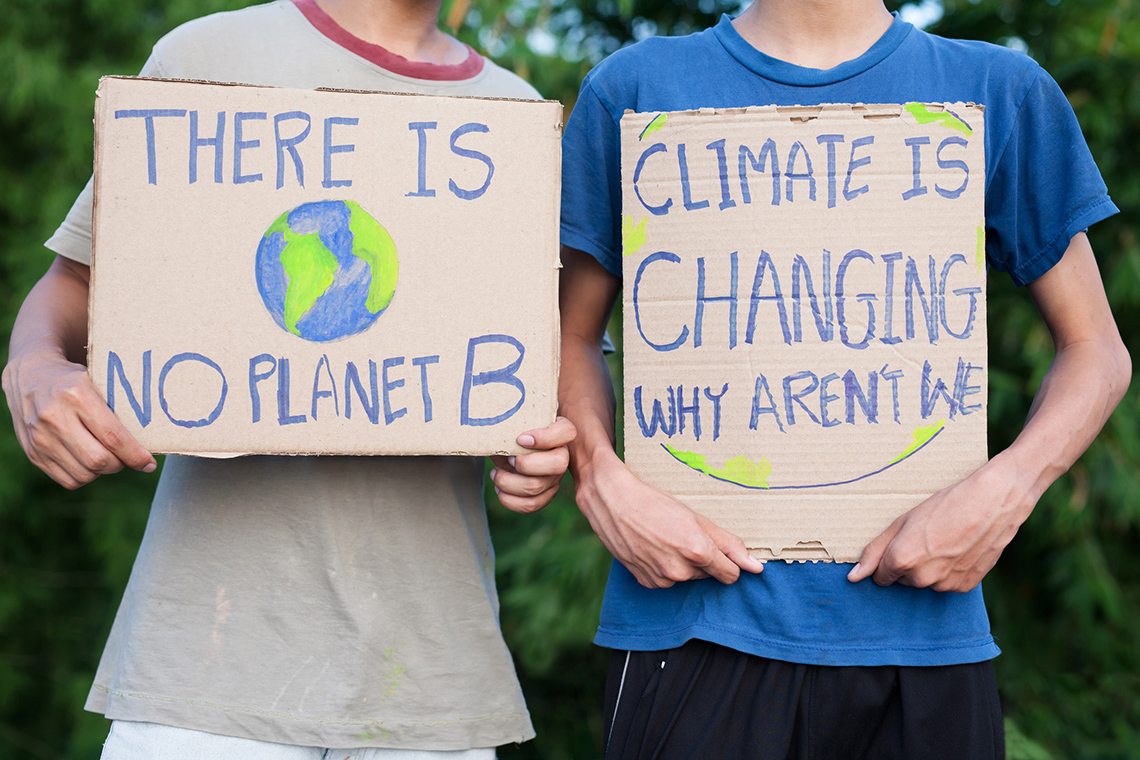
RAN Chart
What is a RAN Chart? A RAN Chart is an acronym for Read and Analyse Non-fiction. The chart is started with what information you already think you know. As you research your topic, use your findings to confirm or change your beliefs. Finally, record what new information you have learned.
Complete the first two columns of the following RAN Chart for what you think you know and what you are wondering about climate change. In your RAN Chart, brainstorm and jot down your ideas about the following questions.
- What does climate change mean?
- What are the causes?
- How can we help?
You will return to the RAN Chart at the end of the learning activity complete the activity by summarizing what you’ve learned.
Complete the RAN Chart in your notebook or using the following fillable and printable document. You can also use another method of your choice.
| What I Think I Know | |
|---|---|
| Wonderings | |
| Confirmed | |
| Misconceptions | |
| New Information |
Press the ‘Activity’ button to access RAN Chart.
Action
Task 1: Climate change

Climate change describes the change in the average conditions – such as temperatures and rainfall – in a region over a long period of time. Some climate change has always been a naturally occurring process, so what’s different now?
Use your Grade 8 perspective as you explore this video from The Space to learn more about climate change.
Rising sea levels
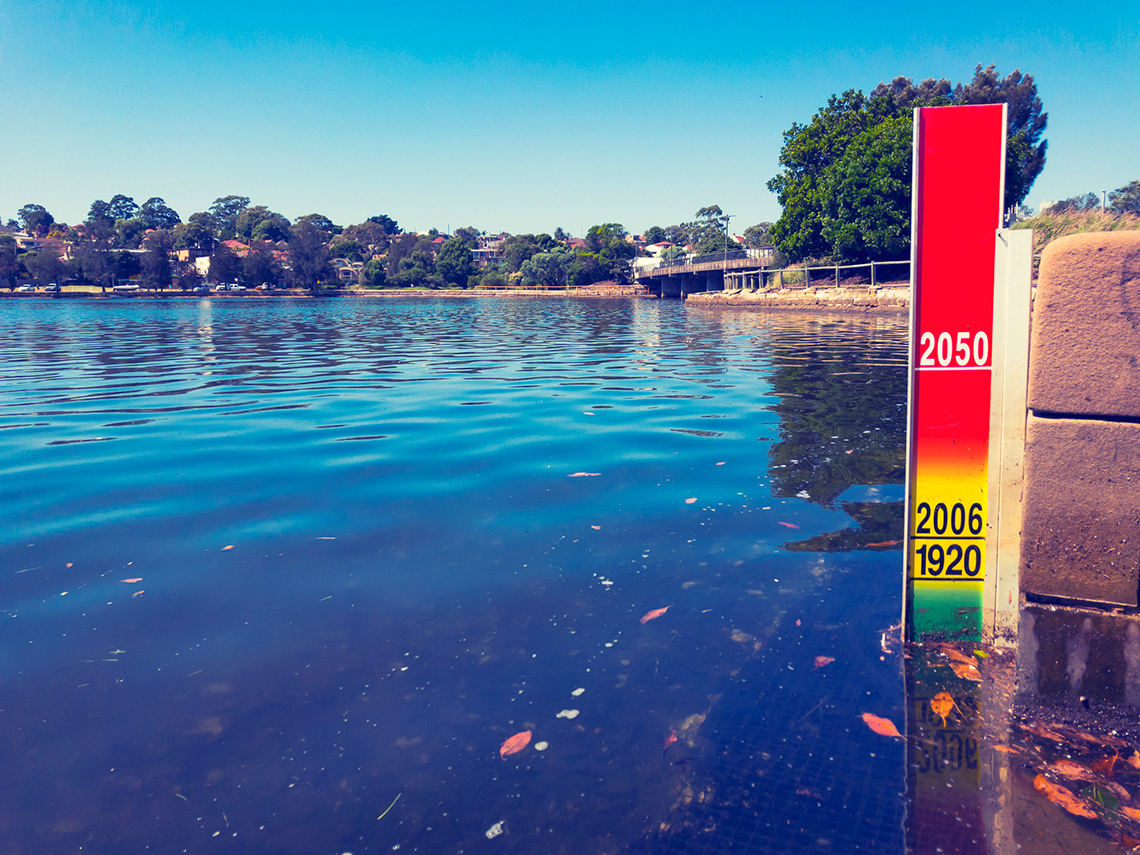
Human settlements are not immune to change or danger. One of the imminent threats to human settlements along coastal areas are rising sea levels. Scientists believe that rising sea levels are due to two factors: melting ice caps and overall warmer temperatures of the sea.
Brainstorm
Brainstorm

What would be some concerns if all the ice on Earth melted? What would happen? Record your predictions in your notebook, on a computer, or using a method of your choice.
- What would be some concerns if all the ice on Earth melted?
- What would happen?
Record your ideas in a notebook or another method of your choice.
Access this video entitled “The Big Thaw” by The Water Brothers to learn more about melting ice caps in the Arctic and Greenland.
Complete the following The Big Thaw – Follow Up Questions activity in your notebook or using the following fillable and printable document. You can also use another method of your choice.
| What will happen if all of the ice in the Arctic and Greenland melts? | |
| How is climate change affecting biodiversity? Why are scientists using birds to study the affects on biodiversity? | |
| If there are still questions that you have (e.g. who would be impacted the most by rising sea levels?), conduct further research independently and record your findings. |
Press the ‘Activity’ button to access The Big Thaw – Follow Up Questions.
Natural disasters
Explore the following map of the world that highlights significant climate events since 2016.
- What do you notice?
- Do you believe these anomalies are the effects of climate change?
- Why or why not?
Record your ideas in a notebook or another method of your choice.
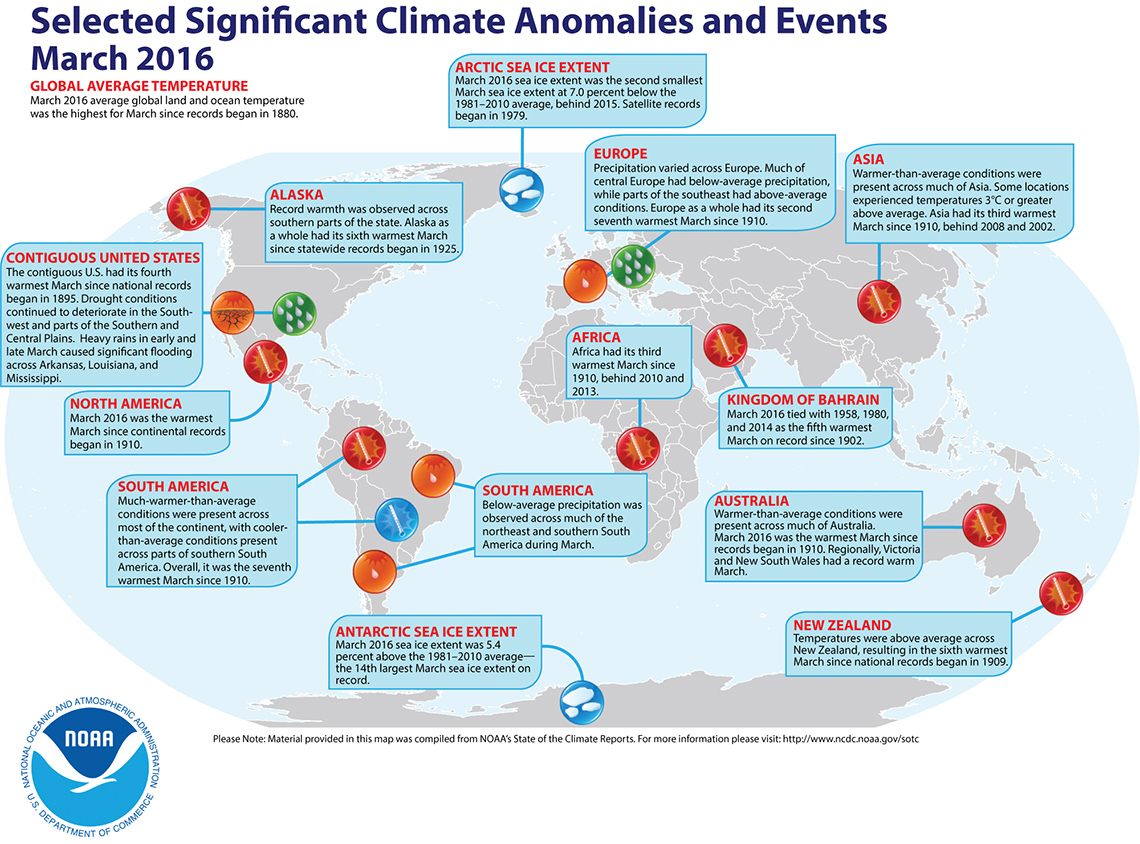
A world map with icons accompanied by labelled countries or continents and a description of the climate events. There are 6 icons for 6 diverse climate events. The 6 icons are a spiking thermometer to indicate extreme heat, a sun with only one rain drop to indicate low rain levels, a sun with cracking earth to reveal drought, a cold thermometer to reveal unusually cool temperatures, pieces of ice to indicate melting ice, and many rain drops to indicate flooding. North America has a spiking thermometer in Alaska, a pieces of ice icon on the eastern edge of Greenland. In the United States, there is a drought icon on the West coast of the USA and a flooding icon in the southern center of the USA. The southern part of North America including Mexico has a spiking thermometer. South America has a spiking thermometer in the northern regions, a sun with one rain drop in Brazil, a cooler temperature thermometer in the center of South America, and a sun with on rain drop in the southern region. Antarctica has a pieces of ice icon. Europe has a sun with one rain drop icon on the western regions including France and Spain, and a many rain drops icon in the eastern regions including Germany. Africa has a spiking thermometer icon in the southern central region. In Asia, the Kingdom of Bahrain in the Middle East has a spiking temperatures icon. The northern center of China has a spiking temperatures icon. Australia and New Zealand both has spiking temperatures icons. Each icon is accompanied by a descriptive label indicating the particular events, which are explored in the following section.
DescriptionSelected Significant Climate Anomalies and Events, March 2016
Global Average Temperature
March 2016 average global land and ocean temperature was the highest for March since records began in 1880.
Alaska: Record warmth was observed across southern parts of the state. Alaska as a whole had its sixth warmest March since statewide records began in 1925.
Contiguous United States: The contiguous U.S. had its fourth warmest March since national records began in 1895. Drought conditions continued to deteriorate in the south-west and parts of the Southern and Central Plains. Heavy rains in early and late March caused significant flooding across Arkansas, Louisiana, and Mississippi.
South America: Much-warmer-than-average conditions were present across most of the continent, with cooler-than-average conditions present across parts of southern South America. Overall, it was the seventh warmest March since 1910. Below-average precipitation was observed across much of the northeast and southern South America during March.
Antarctic sea ice extent: March 2016 sea ice extent was 5.4 percent above the 1981-2010 average – the 14th largest March sea ice extent on record.
Arctic sea ice extent: March 2016 sea ice extent was the second smallest March sea ice extent at 7.0 percent below the 1981 – 2010 average, behind 2015. Satellite records began in 1979.
Europe: precipitation varied across Europe. Much of central Europe had below-average precipitation, while parts of the southeast had above-average conditions. Europe as a whole had its second seventh warmest March since 1910.
Africa: Africa had its third warmest March since 1910, behind 2010 and 2013.
Asia: Warmer-than-average conditions were present across much of Asia. Some locations experienced temperatures of 3 degrees Celsius or greater above average. Asia had its third warmest March since 1910, behind 2008 and 2002.
Kingdom of Bahrain: March 2016 tied with 1958, 1980, and 2014 as the fifth warmest march on record since 1902.
Australia: Warmer-than-average conditions were present across much of Australia. March 2016 was the warmest March since records began in 1910. Regionally, Victoria and New South Wales had a record warm March.
New Zealand: Temperatures were above average across New Zealand, resulting in the sixth warmest March since national records began in 1909.
At the beginning of this task, you explored a video in which David Suzuki highlighted how climate change is “different” this time, and how it is happening at an increasingly rapid rate. This change in climate has significantly impacted the severity of natural disasters that we experience today.
Brainstorm a list of natural disasters.
Record your ideas in a notebook or another method of your choice.
Press ‘Natural Disasters’ to reveal possible answers you may have included on your list.
- earthquake
- flood
- wildfire
- tornado
- tropical cyclone
- tsunami
- landslide
- volcano eruption
- drought
- heat wave
- severe storms
- volcano
Brainstorm
Brainstorm
Check out this video entitled "A Big Storm, A Warming Planet" to learn more about climate change.
How is climate change connected to the intensity of natural disasters? Give one example from the explored video.
Record your ideas in a notebook or another method of your choice.
Investigating natural disasters
For this task, you will choose one of the following natural disasters from the videos and articles provided to investigate. Evaluate the consequences and impacts of your chosen natural disaster. Did climate change play a role?
After you choose and research a natural disaster, you will complete the following Climate Change Impacts graphic organizer to record your findings.
The following links are provided as a starting point. You may want to conduct further research on your own.
Wildfires
Check out the video entitled “Fighting With Fire” to learn more about the changing challenges of wildfires.
Check out the following article entitled “Climate Roundup: Canada’s wildfire Problem Rages On.”
Press tvo today to access "Climate Roundup: Canada’s Wildfire Problem Rages On."
tvo today (Opens in a new tab)Drought and farming
Access the video entitled “Farming in a Changing Climate” to learn more about the impact of climate change on agriculture in Ontario.
Check out the following article entitled "Farming in the Face of Climate Change.”
Consider what you’ve learned about your chosen natural disaster.
Complete the Climate Change Impacts in your notebook or use the following fillable and printable document. You can also use another method of your choice.
| What was the natural disaster that occurred? | |
| Who/what area of the world did it affect? | |
| Did climate change play a role in the development and/or intensity of this natural disaster? | |
| What were the short- and long-term impacts of this natural disaster? |
Press the ‘Activity’ button to access Climate Change Impacts.
Task 2: Effects of human settlement

Human settlement does not occur without challenges to the natural environment. Every time a new settlement is created or expanded, it impacts the surrounding areas.
Brainstorm
Brainstorm a list of ways that human settlement affects nature in your notebook, on a computer or using a method of your choice.
Examine the two following photos. What differences do you notice?
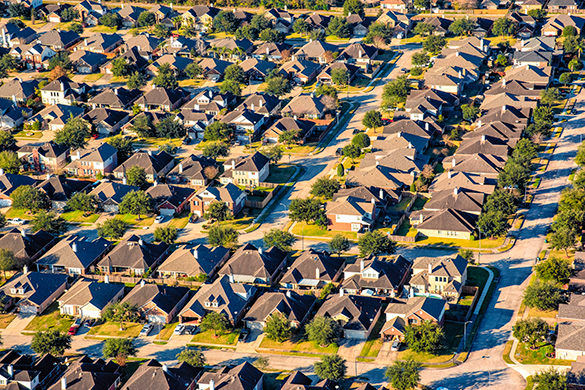
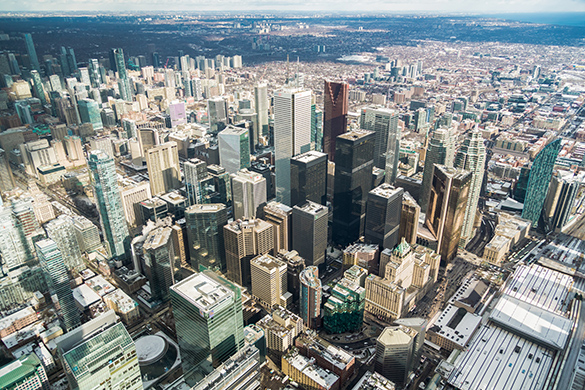
The Greater Toronto area is growing at a rapid rate, which comes with many consequences to the natural environment. Every time a new subdivision is built, a section of agricultural land is lost. If subdivisions, like the one you explored in one of the previous images, are not planned well then they can lead to urban sprawl.
Urban sprawl is defined as the rapid expansion of cities and towns with an increased reliance on the private automobile for transportation.
One of the images you previously explored in a planned urban area, like Toronto, with a mix of commercial, residential, and recreational land use.
Inquiry: Effects of human settlements
Your task is to explore one of the effects of human settlement, using the inquiry process.
Inquiry is a multi-step process used to formulate questions, gather, organize, and analyse information, evaluate and draw conclusions, and communicate results.
Although the stages are not always done in the same order, this graphic provides a detailed summary of these steps. Examine the following ‘Inquiry Process’ diagram to learn how the steps relate.
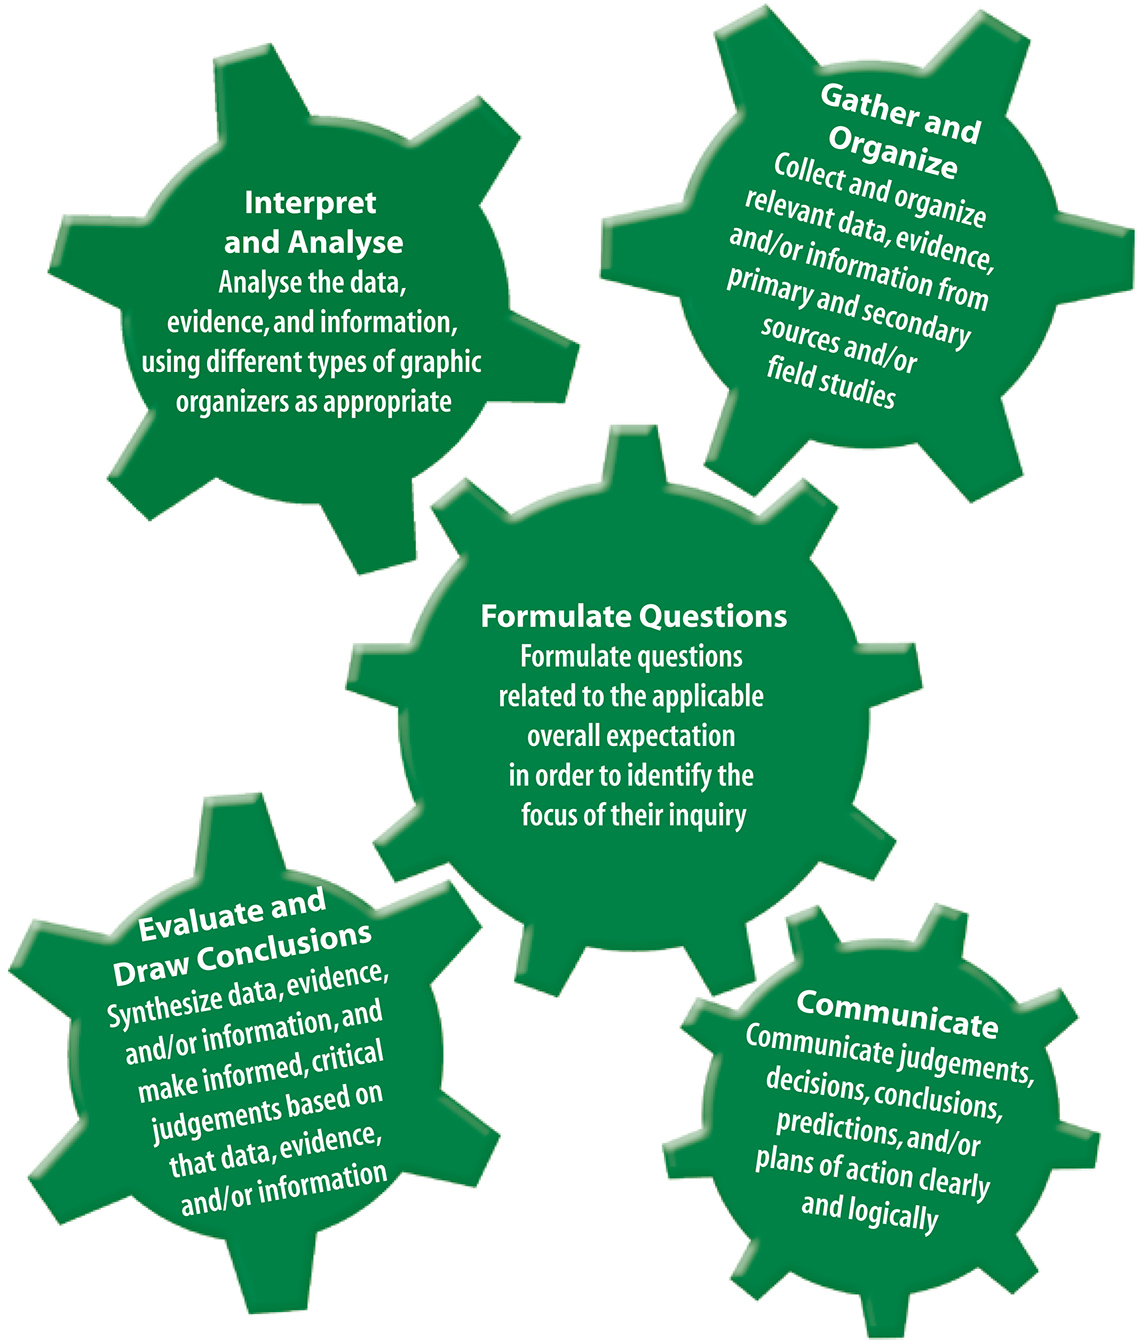
The Inquiry Process Gather and Organize: research and record data, evidence and information in graphic organizers. Consider using primary sources, secondary sources and/or field studies Interpret and Analyse: evaluate your researched data, evidence and information and organize it according to your research needs Formulate Questions: create questions about your research to focus your findings Evaluate and Draw Conclusions: use your findings to make knowledgeable statements based on your research Communicate: share your questions and conclusions in a clear and factual method
Source: http://www.edu.gov.on.ca/eng/curriculum/elementary/social-studies-history-geography-2018.pdf
Human Settlement Effects Choices

Use the following Inquiry Process – Human Settlements graphic organizer to help you gather and organize information. After your complete your research, you will communicate the results of your inquiry in a method of your choice (e.g. a report, poem/song, website, blog post, slideshow, photo essay).
Complete the Inquiry Process – Human Settlements in your notebook or using the following fillable and printable document. You can also use another method of your choice.
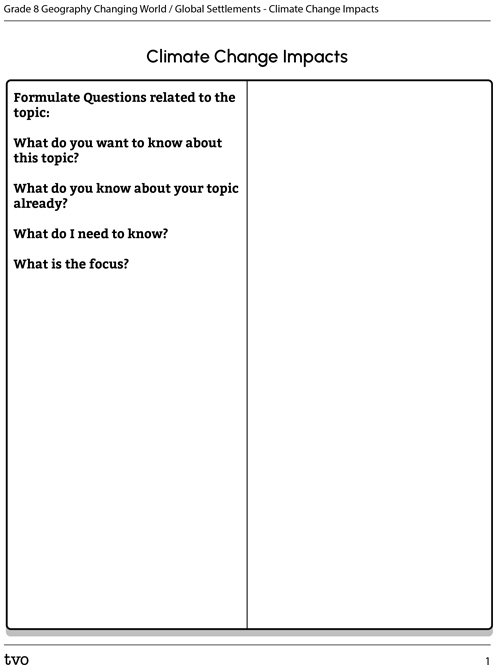
Press the Activity button to access Inquiry Process – Human Settlements.
Activity(Opens in a new tab)Consolidation
Task 1: Summarizing
Refer back to the RAN chart you created about climate change at the beginning of this learning activity. Complete the final three sections using the new information you have learned.
- What was confirmed about your beliefs?
- What misconceptions did you have?
- What new information did you learn?
| What I Think I Know | Wonderings | Confirmed | Misconceptions | New Information |
|---|---|---|---|---|
Task 2: Educate your community!

You are going to educate your community about one of the important topics that you learned about today by creating a public service announcement. You can record your public service announcement in your notebook, on a computer, or use another method of your choice.
A public service announcement is a video that is created to raise awareness and change public attitudes and behaviour towards an issue. The phrase "public service announcement" is often shortened to the acronym PSA.
Effective PSAs often have powerful messages and images that stick with the viewers. Use the following checklist to help guide your PSA design.
Reflection
As you read the following descriptions, select the one that best describes your current understanding of the learning in this activity. Press the corresponding button once you have made your choice.
I feel...
Now, expand on your ideas by recording your thoughts using a voice recorder, speech-to-text, or writing tool.
When you review your notes on this learning activity later, reflect on whether you would select a different description based on your further review of the material in this learning activity.
