Minds On
Gathering information on resource extraction
Brainstorm
Let's explore
Explore the following sources of information when considering the impact of resource extraction.
Using a method of your choice, reflect on the following questions:
- What kind of information can we get about resource extraction from each source?
- What are the differences between these sources?
- Whose perspective is being shared in each source and what information is missing?

A stack of newspapers

A person looking through the lens of the video recorder while holding it close to his face.
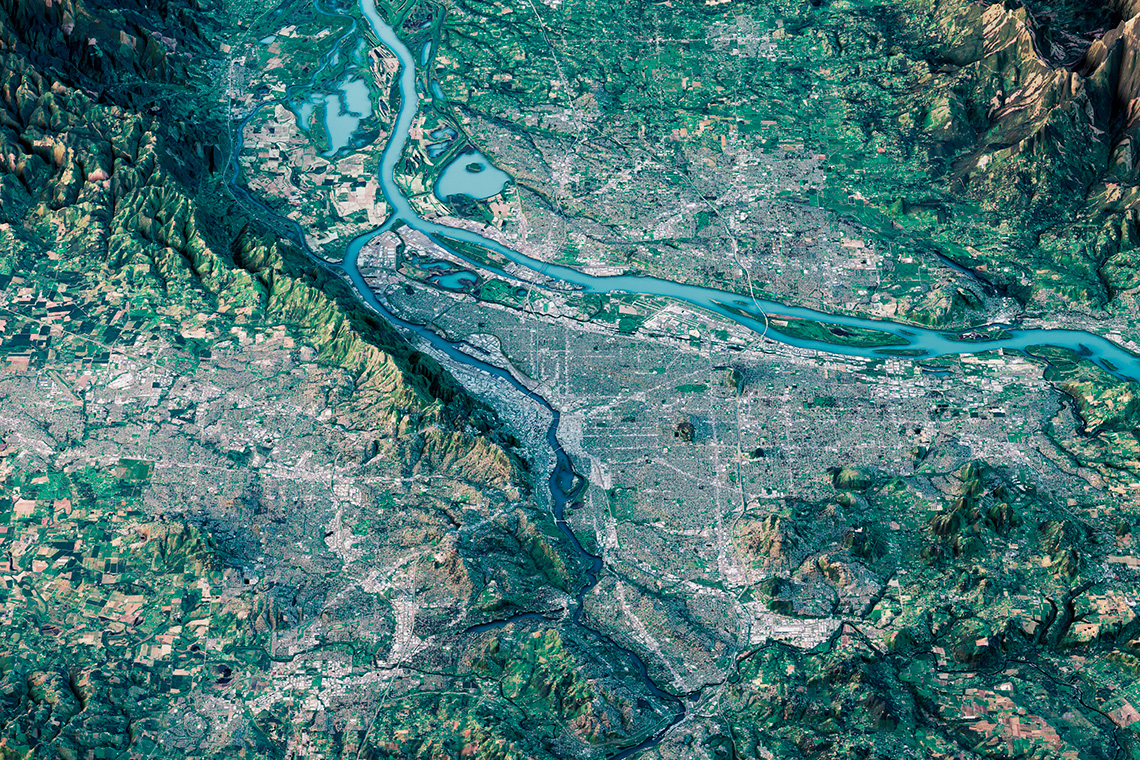
This image shows satellite footage of the Amazon River and the surrounding land, including roads, communities and larger buildings and structures. The image is taken from a high altitude and gives a birds eye view of this location.
Action
Gathering information

There are many sources we can use when gathering and organizing information about the impact of resource extraction and flow resources. Reflect on the images in the Minds On section.
Newspaper articles and other online platforms
Newspaper articles and articles on a variety of websites are useful because they usually present facts surrounding a story and may include statistics and figures. They also often feature an interview with people affected by resource extraction in the region. For example, articles can include interviews with Indigenous peoples on their personal experiences, which adds perspective to the story.
Consider the following article’s headline as an example: "Climate roundup: How Waste Carbon Can Become a Valuable Resource". The article headline indicates the main point of the researched story. Check out the following parts of this article.
The article presents information on how what may be considered waste can be used as a resource for energy. Rather than attempting to capture carbon dioxide and pump it into the ground (one of the potential ways of dealing with carbon dioxide), the author asks the question:
“why take on the hassle, expense and long-term risk of capturing carbon dioxide and pumping it into the ground when that same gas can be used to make fuels, plastics, concrete, fertilizers, foods and a range of other products that society needs?”
You will now access the article "Climate Roundup: How Waste Carbon Can Become a Valuable Resource".
Press tvo today to access "Climate Roundup: How Waste Carbon Can Become a Valuable Resource."
tvo today (Opens in a new tab)Press ‘Climate Roundup’ to reveal the information about the article.
The author goes on to shed light on a Toronto company that is using carbon dioxide to grow algae that can be turned into fuel and chemicals.
Like many articles, the author both provides a valuable source while they educate and provide viable solutions to resource extraction and climate change.
Documentary films
Along with newspaper articles, documentary films are also useful because they usually present a combination of facts, statistics, and figures as well as interviews with those most affected by resource extraction.
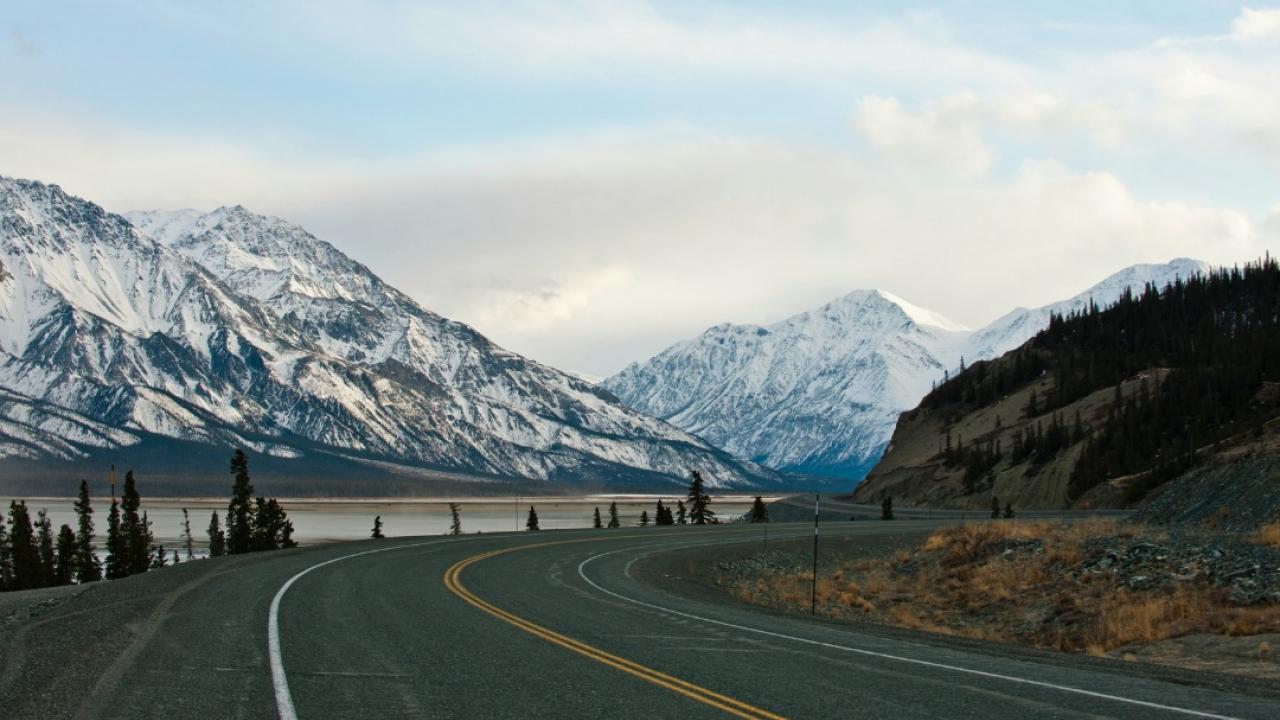
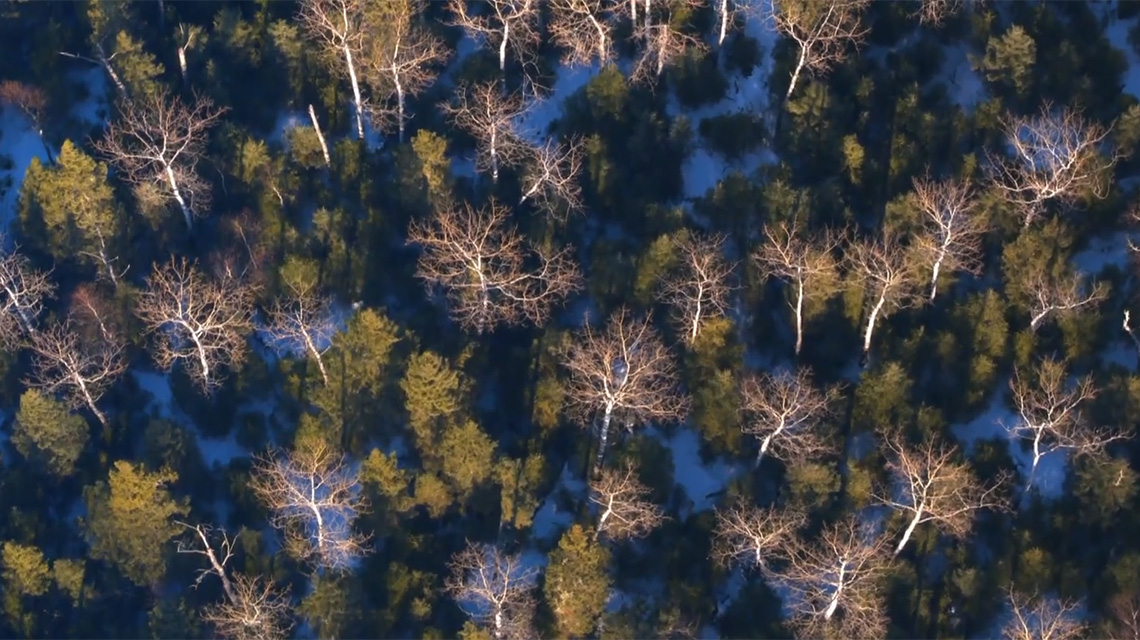
An example of a documentary film that examines the changes occurring in the boreal forest due to external forces such as deforestation is "Borealis". The film focuses on the impact of climate change on the boreal forest in Canada with particular attention to the role of fires, insects, and human development.
Press ‘Borealis’ to reveal more information about this TVO documentary.
The documentary film provides reasons for the decline of bird, caribou, and fish populations in the boreal forest. Reasons include deforestation for the timber industry and the thawing of permafrost as a result of climate change.
Satellite imagery
Satellite imagery can be used to show the impact of resource extraction. It presents the raw data. For example, in the case of dam construction in Brazil, the reservoir led to the creation of a series of islands. Not only can we understand how the physical features of the land changed, but we can ask questions as to how that change impacted local populations and wildlife.

Check your understanding
Now that we have considered a variety of sources that can be used to explore the topic of extraction and its impact, complete the following multiple-choice activity. Choose the correct answer for each question.
Connections
Let's review what we learned
Do you think the website of the resource companies involved would be a good source for such information? Why or why not?
Press ‘Hint’ to reveal more questions to help guide your review.
Case study: Aswan High Dam in Egypt
The construction of dams has particularly influenced the remaking of maps. Often, Indigenous peoples have had to relocate and abandon their homes and lands. One of these well-known cases includes the construction of Aswan High Dam in Egypt.
Press ‘Aswan High Dam’ to reveal additional information on this dam in Egypt.
The Aswan High Dam in Egypt was built in the Nile River and created a 500 km reservoir known as Lake Nasser. One of the reasons for it construction was to ensure irrigation would not be interrupted by drought and other environmental factors.
Its construction led to the relocation of 100,000 people, including Nubian and Sudanese peoples to towns such as New Wadi Halfa in Sudan. Ancient Egyptian temples also had to be relocated, as well as entire towns that were submerged. Resettlement communities were created at government expense. However, not all of the people in resettlements were compensated for financial losses in their respective professions.
The map of the Aswan High Dam and surrounding regions marks a dramatic shift in the geographic landscape from its original features.
 Description
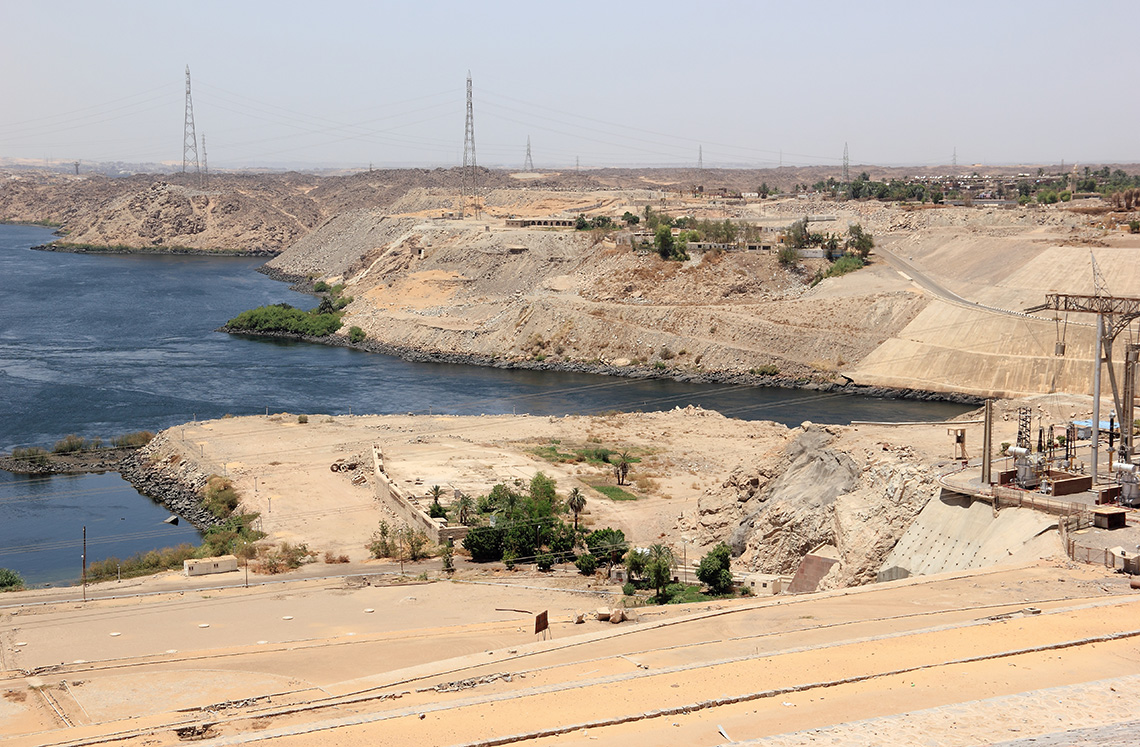
The image shows the Aswan High Dam reservoir - Lake Nasser. Dark blue water meets the steep rocky coastline, upon which are several white and orange building structures in the middle and background of the image. Power lines are also shown in the background and run across the body of water to the other side.
Let’s consider Aswan Dam by exploring two sources on the dam – a photograph and a satellite image. Using a method of your choice, respond to the reflection questions that follow.
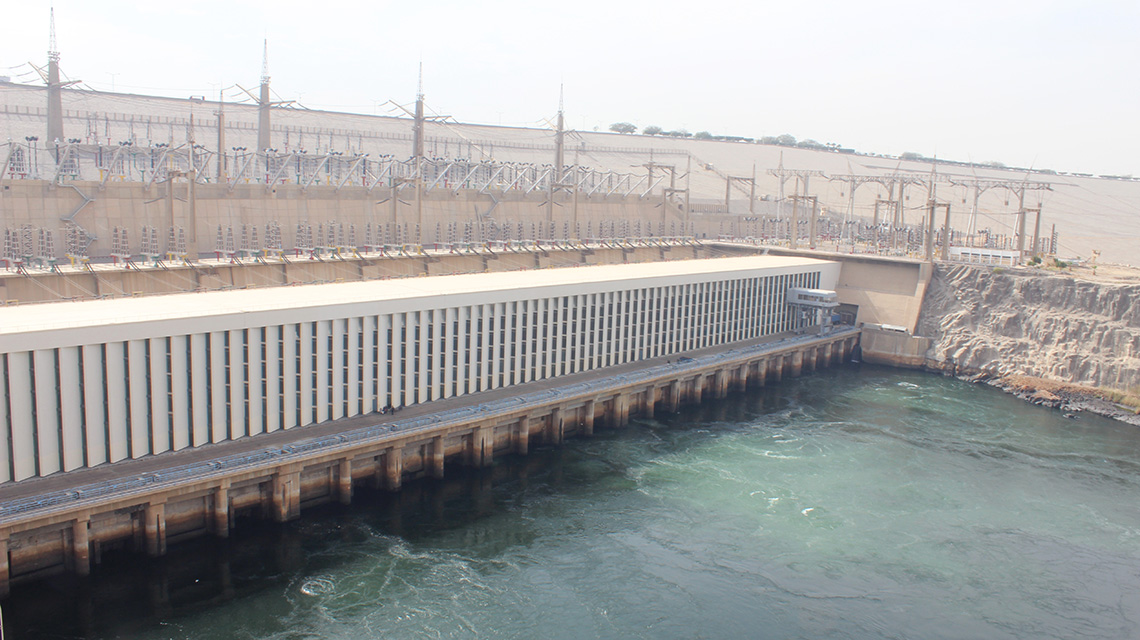 Description
The image shows Aswan Dam. The image shows water flowing from the dam with a greenish colour under the water where it is fast moving with bubbles before becoming dark blue as it settles. The riverside is barren rock. Electricity is carried from the dam via a series of towers that extend into the background.
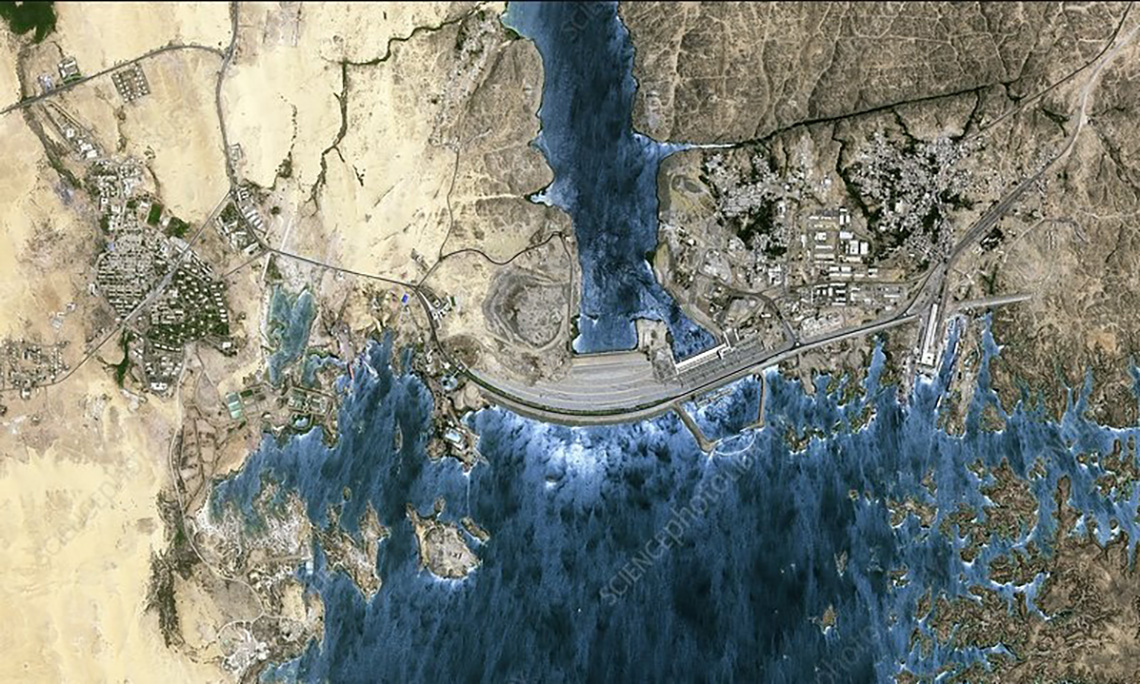 Description
The image shows a satellite image of Aswan Dam. The image shows dark water on the outside of the dam but lighter coloured water that is closer to the dam. There is land on either side of the dam on the outside and on the inside.
Connections
Review questions
What information can you get from the photograph of Aswan Dam as compared with the satellite image of Aswan Dam?
Press ‘Hint’ to reveal some ideas.
What other information do you need to understand the story of the Aswan Dam and where might that information come from?
Press ‘Hint’ to reveal some ideas.
Analysing GIS maps
We have explored how to gather information using imagery and the written word but there is another way to gather important information about topics such as resource extraction.
Maps not only provide the geographical features of a region but can also raise questions about the impact of resource extraction on the environment and societies that make up the region.
One of the most useful maps for understanding the physical and social features of a region is a GIS map (geographic information system). GIS maps gather, manage, and analyse data with particular attention to spatial location data. It then organizes information in 3D scenes and maps.
GIS maps can be useful for understanding who will be impacted by resource extraction. For example, when a site is being surveyed for resource extraction, a GIS map can be used to show the location for extraction as well as local inhabitants’ proximity to the site. This may make for better choices of where to extract resources at minimal impact to local communities.
GIS mapping is when layers of data are added to a piece of GIS software to create a map. One of the most common types of GIS maps are heat maps. A heat map shows clustering or density of data. Where the “hot spots” or densest data exists, markings show up on a map.

Case study: Croatia
This heat map is displaying ground temperatures and heat flow in different areas of Croatia due to geothermal resources in those areas.

What do you need to know about a heat map in order to understand how to analyse the data?
- What information does the legend of the heat map share? This legend shares the ground temperature of the different areas of Croatia. The higher the temperature, the more resources appear in that area – the “hot spots”
- What information does the map share? The map is colour coded in relation to the information shared on the legend.
Exploring heat maps and resource extraction
Search for GIS heat maps involving oil refineries or deforestation locations around the world and explore the following questions.
- How do you read this GIS heat map?
- What data can you analyse from a few different heat maps on this topic?
- What observations can you make about this topic using these heat maps? What conclusions can you draw?
- Do GIS heat maps make understanding this data easier? Why or why not?
Consolidation
Comparing sources on the same topic
Let’s consider two sources on pipelines. The first is a snippet that shares a short summary and an image of an interview and the second is a map of pipelines in Canada. After considering both the interview information and the map, compare each source on the topic in an organizer.
Source one
An interview on TVO’s The Agenda, titled “Indigenous Rights and Building Pipelines” featured Serge Simon, the Grand Chief of the Mohawk Council of Kanesatake. The interview explores the topic of building pipelines from an Indigenous perspective.
Explore the short description and image taken from the interview:
“Indigenous groups are gaining strength to oppose, and support, pipeline expansions. The Agenda discusses whether First Nations communities can reap the benefits from the oil sector, or will everyone lose in the long run due to climate change disasters looming on the horizon?”
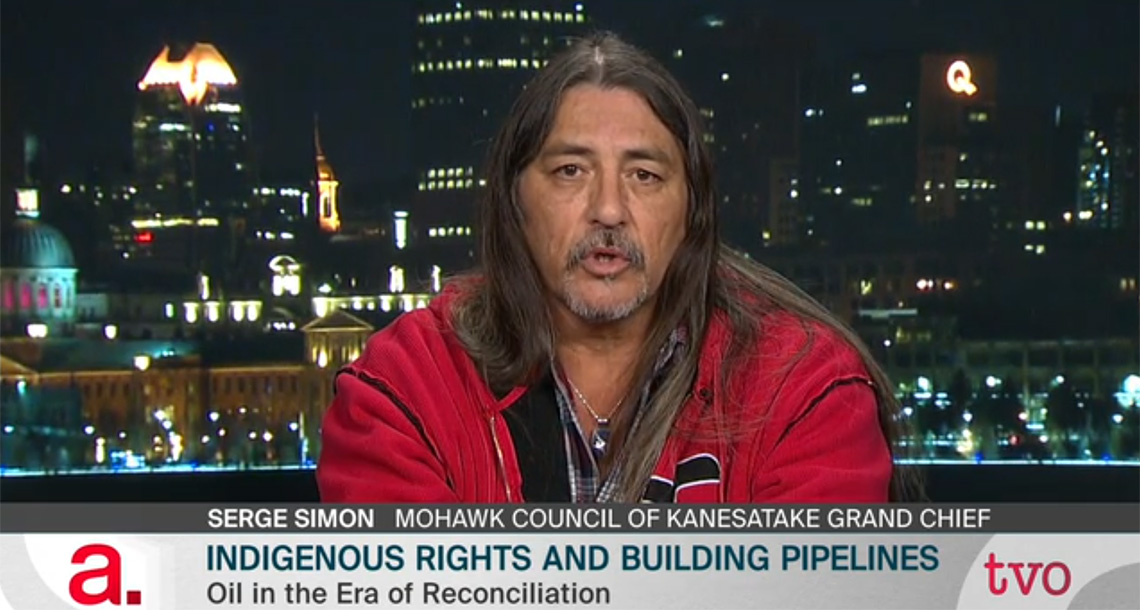
The image shows a TVO interview with person being interviewed and a headline that reads: Indigenous Rights and Building Pipelines.
Source two
Explore the second source, also about pipelines. This source is a map of pipelines in Canada.

The image is a map of pipelines in Canada. The majority of the pipelines are in Alberta and extend outwards to British Columbia, Saskatchewan, the Northwest Territories and even as far east as Ontario and Quebec. The pipelines are listed in the legend entitled 'Pipelines in Canada', are are listed as NOVA Gas, Alliance (Enbridge), Trans Mountain, BC Pipeline (Enbridge), Keystone (TC) Cochin (Kinder Morgan), Line 21 (Enbridge), Foothills, Express (Enbridge), Other Lines (Enbridge) and Mainline (TC).
Next, record the information about pipelines that is available from each source and the information that is missing or whose opinion is not represented in the following organizer.
Comparison
Consider the two sources of information provided. Record the information about pipelines that is available from each source and the information that is missing or whose opinion is not represented in the following Pipelines Notes organizer.
| Source | Information supplied | Information needed |
|---|---|---|
Interview Description/ |
||
Map |
Complete Pipelines Notes in your notebook or use the following fillable and printable document.
Press the ‘Activity’ button to access the Pipeline Notes.
Connections
Connections
Do you think these two sources on pipelines would give you all of the information you need to complete your research. Why or why not?
Press ‘Hint’ to reveal more guidance.
Think of whose perspective is included in each source and whose perspective is not.
What other information and/or types of sources would you need to complete research on pipelines?
Press ‘Hint’ to reveal more guidance.
Think of all of the variety of sources that are available.
What kind of map could be created to provide supporting information on the First Nations that are being impacted by the pipeline? What opportunities for GIS maps exist?
If possible, create a draft of the map using paper and/or digital tools.
Reflection
As you read the following descriptions, select the one that best describes your current understanding of the learning in this activity. Press the corresponding button once you have made your choice.
I feel...
Now, expand on your ideas by recording your thoughts using a voice recorder, speech-to-text, or writing tool.
When you review your notes on this learning activity later, reflect on whether you would select a different description based on your further review of the material in this learning activity.