Noticing and Naming the Learning
What are you going to learn today?
We are learning to…
- sort objects or data using one attribute
- gather data and choose how to record it
- organize data using concrete or picture graphs
- ask and answer simple questions about data shown in graphs
- describe the likelihood of familiar events happening
How do I show what I have learned?
I can…
- sort objects into groups by choosing one way they are the same or different
- collect information by looking, asking, or trying things out
- make a simple graph using pictures or objects to show my data
- ask and answer questions about what my graph shows
- use the words impossible, likely and unlikely to describe events in everyday life
Minds On
Let’s get ready to learn!
Before we begin our learning, let’s wake up our minds with a warm up.

Social Emotional Learning
Warm up
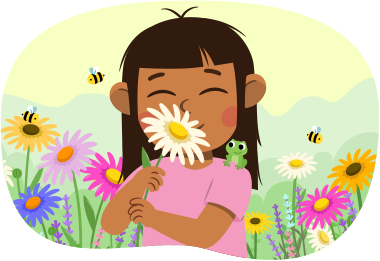
Imagine you are in a field of flowers.
The birds chirp, the bees buzz and you can feel the warm sun on your face.
You gently hold a flower in your fingers.
Bring it up to your face and breathe deeply through your nose and out through your mouth.
Count one, two, three.
Listen to the Flower audio to follow along to get you ready to learn!
Flower
How do you sort?
Have you ever sorted your items like clothes, toys or crayons?
Explore the following photos.
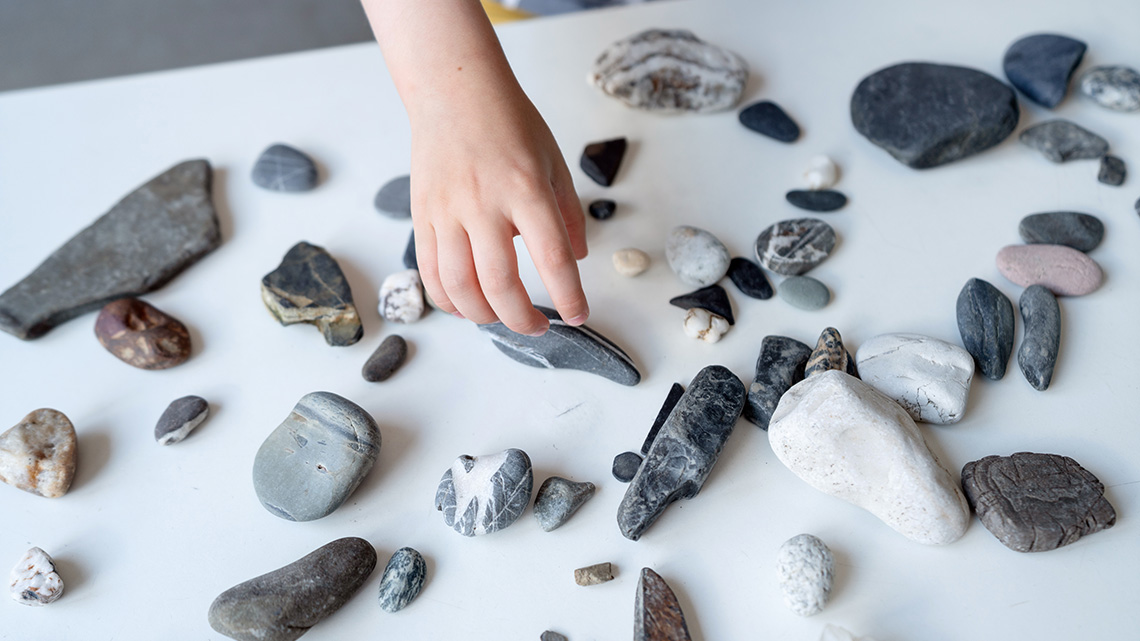
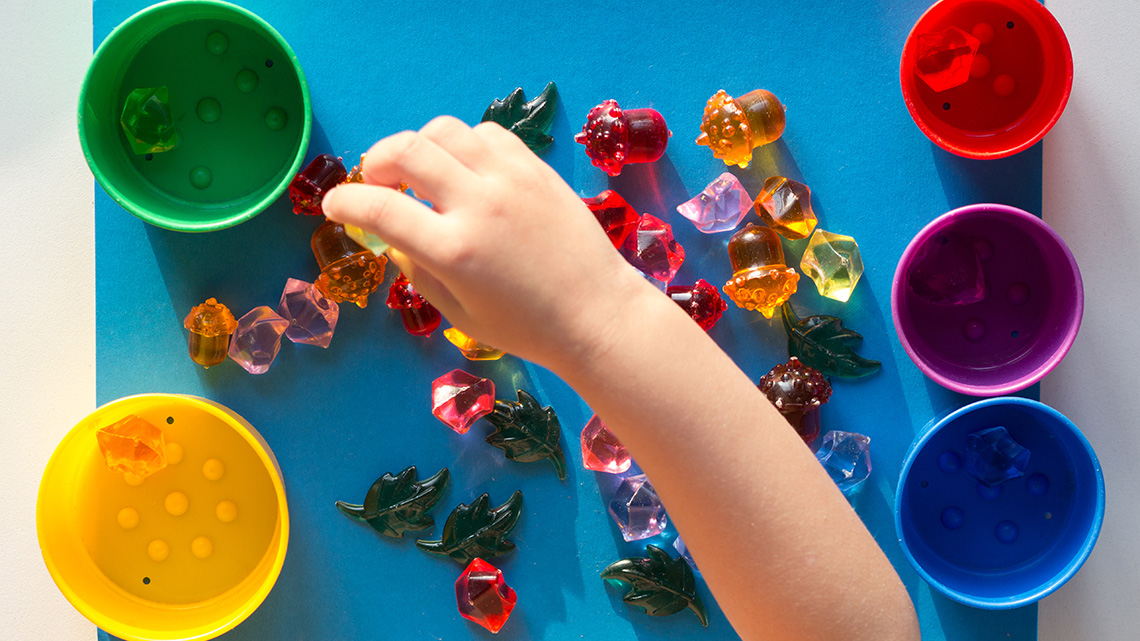
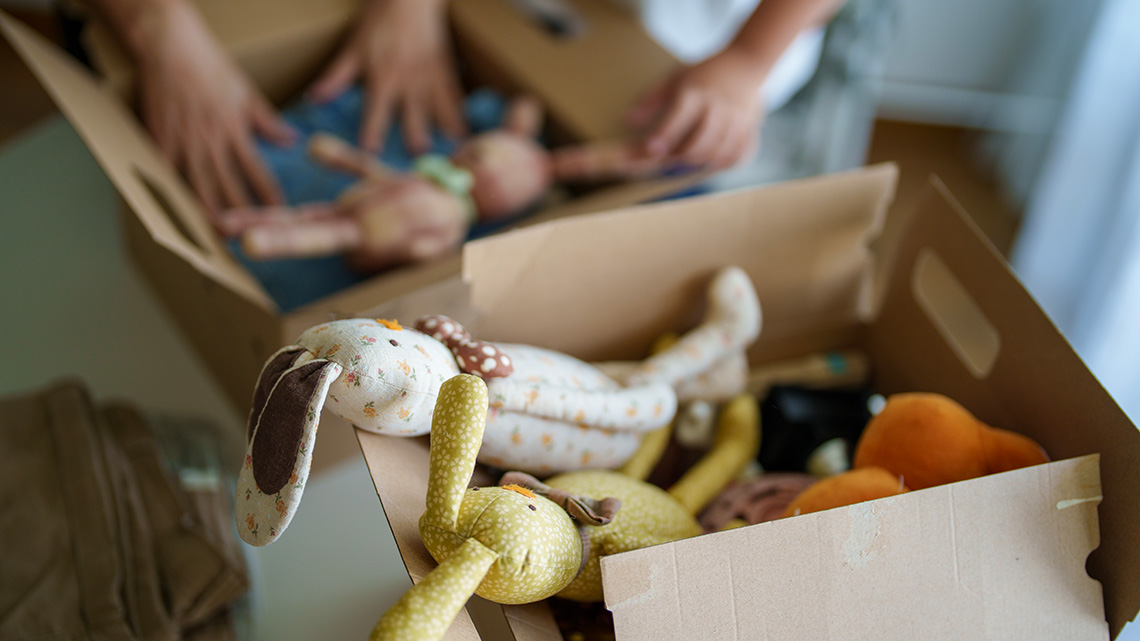
We can sort by colour, size, shape, material and more!
How do you sort your items?
As you work through this learning activity, you can record your ideas in many ways.
Listen to the following audio recording to learn more about how to record your ideas.
How To Record Your Ideas
Action
Collecting data
In the Minds On, we thought about ways we could sort different items.
If we recorded this information, it would be called data.
Data is information we collect about what people might like or not like.
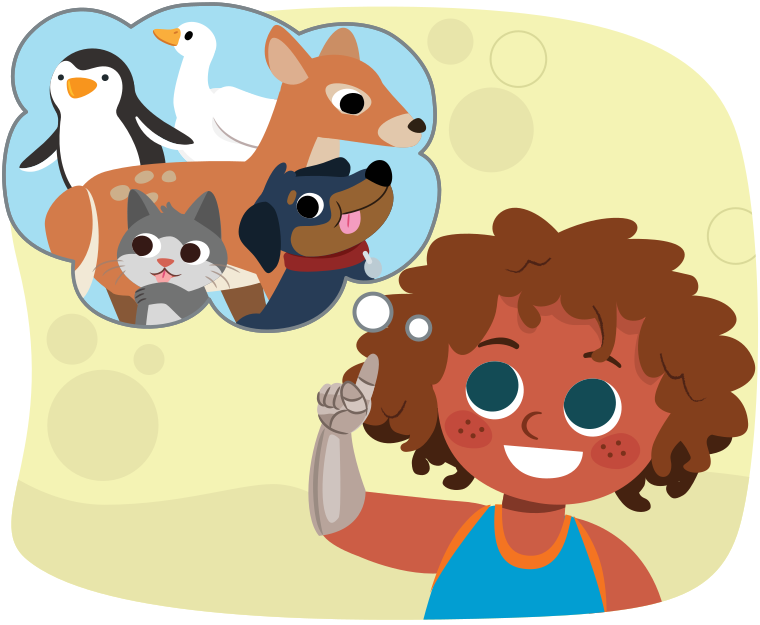
Gabby wants to find out her friend’s favourite animals.
She heard her friends say they like lions, pandas, whales, and owls. So, she gives them those choices and asks which one they like the most.
Gabby wants to find out which animal has more votes than any other animal. That would be the most.
She also wants to know which animal will have less votes than any other animal. That would be the least.
By asking a question and recording the data, Gabby is doing a survey.
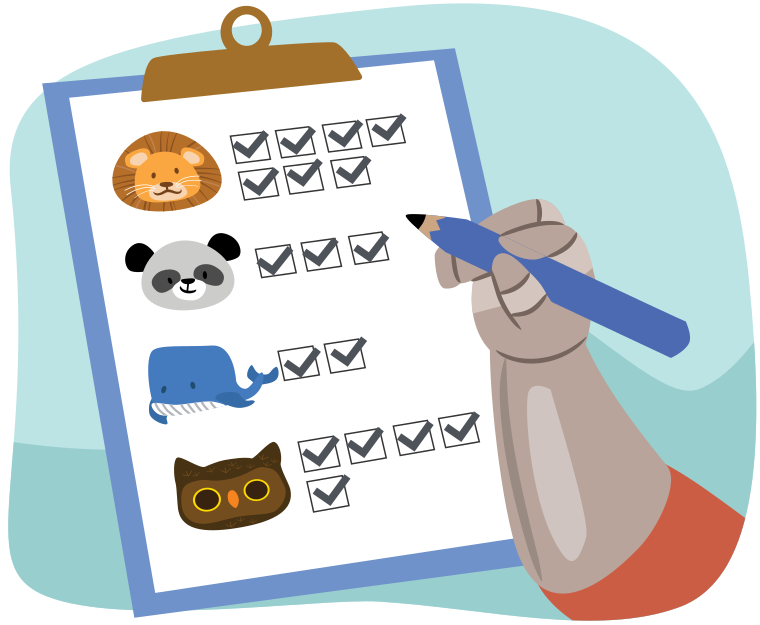
A clipboard with a checklist showing four animals: a lion, a panda, a whale, and an owl. The lion has seven checkmarks, the panda has three checkmarks, the whale has two checkmarks, and the owl has five checkmarks.
What do you notice about how Gabby recorded the information from her survey?
Which animal has the most votes?
Which animal has the least votes?
When you are ready press the Possible Answer button to find.
- I can see and count how many votes each animal got because Gabby used checkmarks to show.
- The lion has more votes than any other animal. The lion has the most votes.
- The whale only has two votes. The whale has the least votes.
Body break!
Let’s take a break and move!
Before you begin:
- Find a safe space. Move anything you might bump into.
- How are you feeling? Listen to your body and take breaks.
- Ask an adult before getting materials or if you need help.
Follow the steps to move your body. You can also follow along with the audio.
Do whatever feels most comfortable for you.
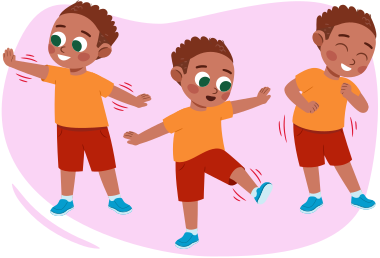
- Start by standing or sitting.
- Gently shake one arm, the other arm, then both.
- Shake one leg and the other leg.
- Gently shake your head, hips, and whole body.
- Repeat this two more times!
Body Shake
Surveys and graphs
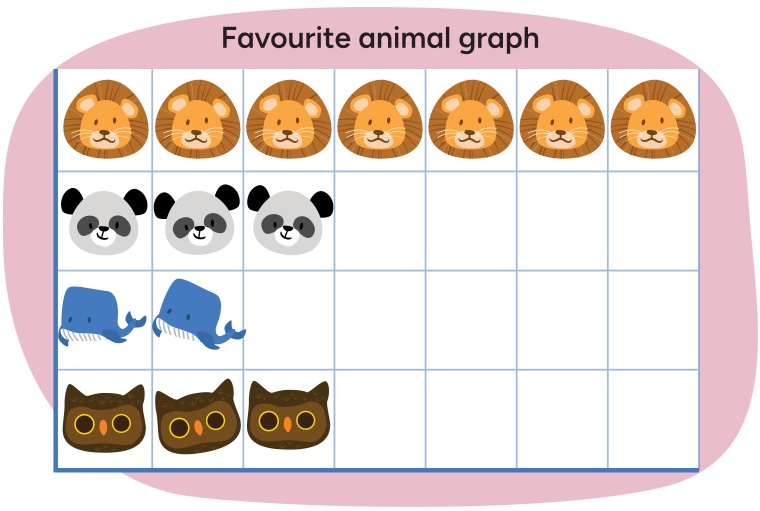
We can show Gabby’s “Favourite animal” survey in another way. This is called a graph.
A graph is a picture or drawing that shows information. It helps us compare things.
What do you notice about the following graph?
Which is the most favourite animal? Which is the least favourite animal?
How do you know?
Gabby had so much fun doing her first survey, she wants to do another one!
This time her question is: “What is your favourite fruit?”
Before she starts recording, Gabby thinks that most of her friends will choose strawberries.
Let’s check out Gabby’s results.
Is she correct?
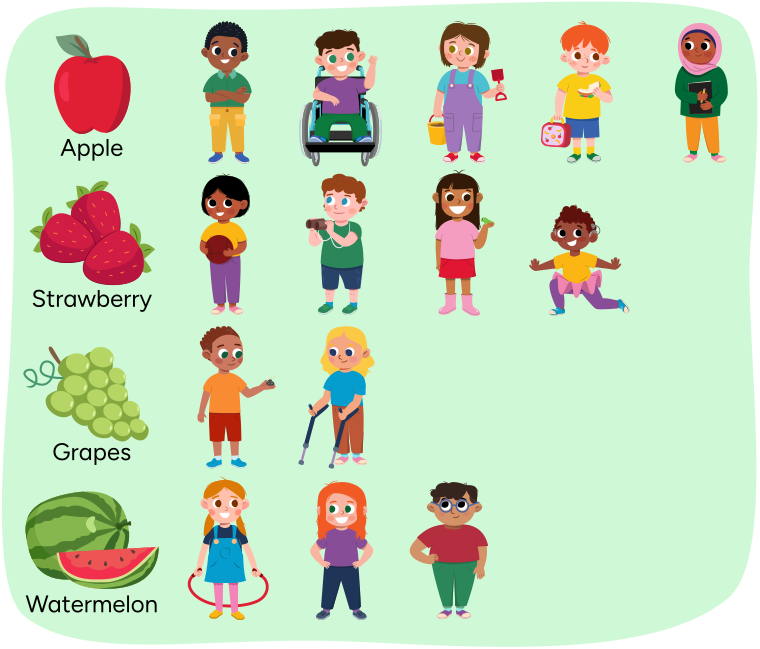
Which fruit did most people like? How do you know?
Which fruit did the least number of people like? How do you know?
How many more people liked watermelon than grapes? How do you know?
Record your answers and share with someone else if you can.
Favourite fruit graph
Let’s create a graph using Gabby’s survey. For each person who likes a type of fruit, fill in one square with that fruit.
For example, for each person who likes strawberries, fill in one square.
Select your chosen fruit, then click on the section of the graph where you want to place it.

Pause and Reflect
Pause and reflect
If we survey a new group of people about their favourite fruits, would their graph be the same as the graph we made today? Why or why not?
Record your thoughts. If possible, share your thoughts with someone else if you can.
Will it happen or not?
When something is likely, it means it will probably happen.
When something is unlikely, it means it probably won’t happen.
When something is impossible, it means it can’t ever happen.
Gabby has a magic bag of crayons and a button. She and her friends are going to take turns picking one item out of the bag at a time.
Gabby goes first.
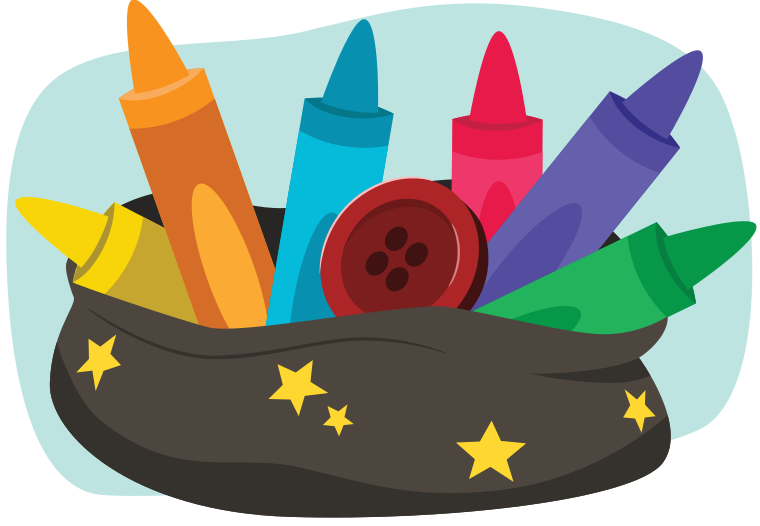
Answer the following questions with likely, unlikely, and impossible.
- Will she pull out a crayon from her bag?
- Will she pull out a button from her bag?
- Will she pull a pencil from her bag?
When you are ready, press the Answer button to find out.
It is likely to pick a crayon on her first try because there are more crayons
It is unlikely to pick a button because there is only 1 button.
It’s impossible to pick a pencil because there are no pencils in the bag.
Learning check!
Let’s explore some different examples. For each picture, decide if it is likely to happen, unlikely to happen, or impossible to happen.

Printing practice
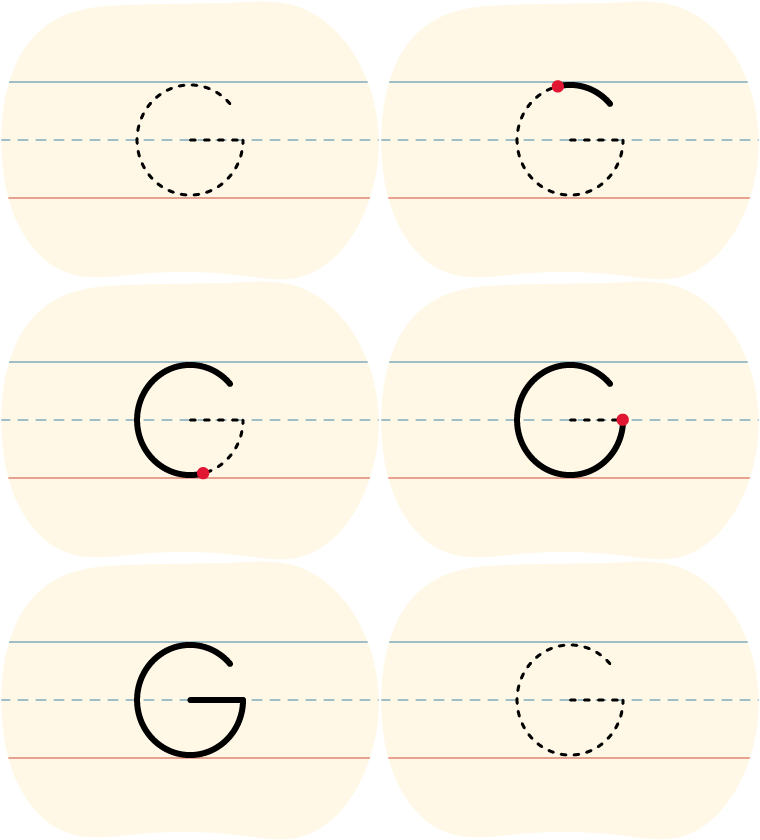
G is for Graph.
Let’s practice printing the letter G.
D is for Data.
Let’s practice printing the letter D.
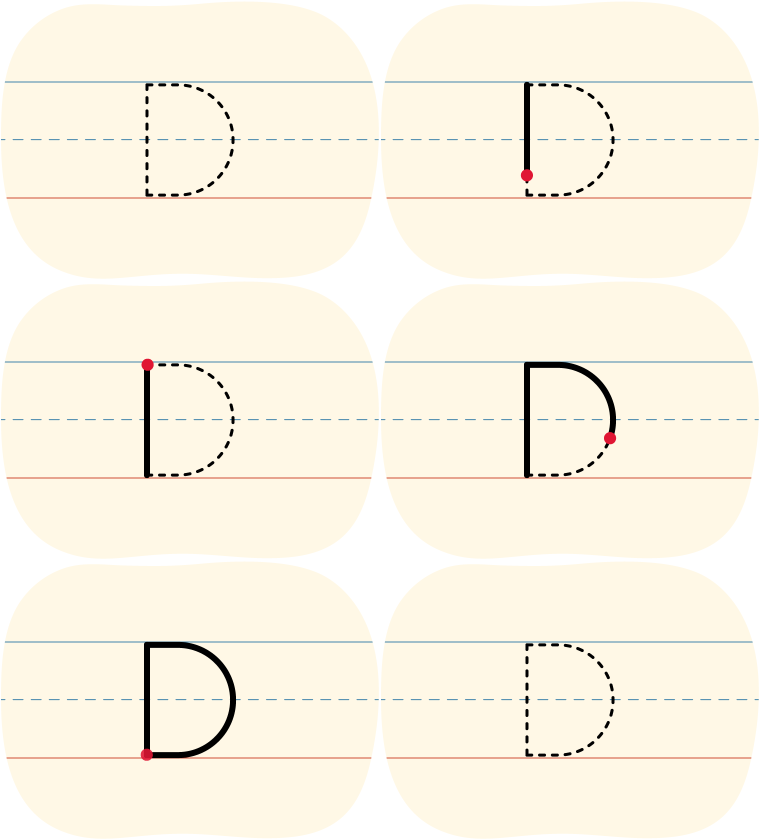
Now, you try!
Practice printing this letter in your notebook or using a method of your choice.
Use the following checklist to learn some printing tips.
When you are printing:
Consolidation
Time to explore!
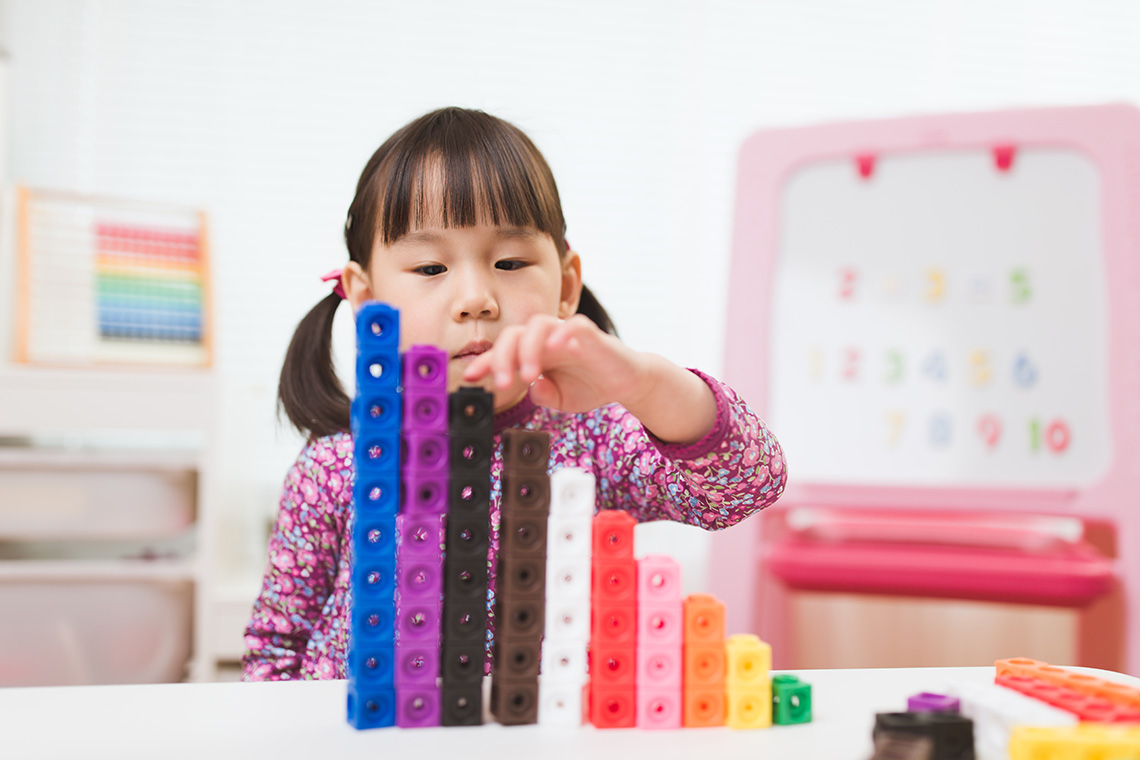
Check out some ideas to help you learn more about data or probability!
You may choose one or more centres to explore.



Arts
Most and least dance
Explore the following graph.
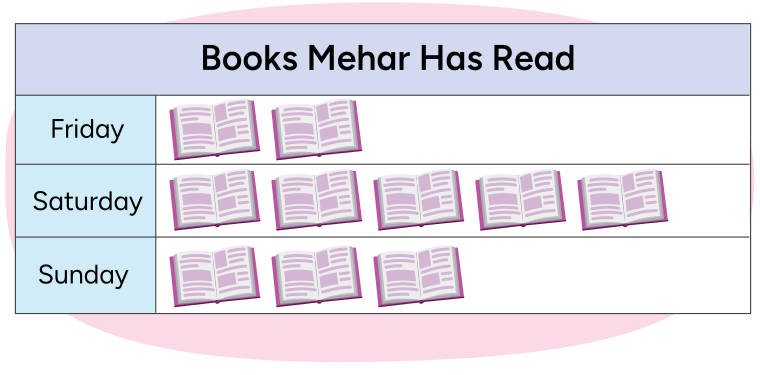
Let’s use dance movements to show or represent the graph results.
Before you begin, press the following tabs to get ready.
Have you moved any objects that you might bump into?
Listen to your body. Take breaks or stop if you need to.
Follow the steps to move your body. You can also do any action that feels most comfortable for you.
Press the following tabs check out each step.
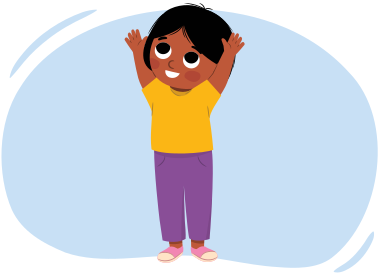
To show that something is the most, you can make your body stretch as big or tall as you can, you can jump or make a big movement of your choice.
Most means the biggest amount.
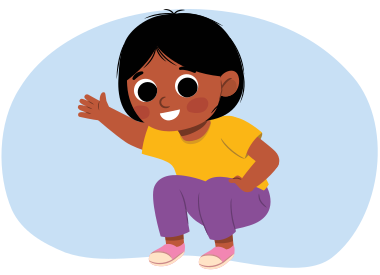
To show the least, you might crouch small or do tiny movements of your choice.
Least means the smallest amount.
We are going to use our bodies to show “the most” and “the least.”
Let’s try it out!
- Look at the books Mehar read on Saturday. What do you notice? Use your body to show what the graph is telling you.
- Now look at the books Mehar read on Friday. What do you notice? Show it with your body!

Inquiry
Let’s sort!
We can sort items in many different ways. For example, we can sort by shape, colour, and type.
Explore the following images. How might you sort each?
Place the cards into categories that best match. Use the arrow buttons to navigate between cards.

Movement
Will it happen?
Let’s play a game!
For each situation, decide whether it is likely, unlikely, or impossible. Then choose a movement that best fits. You may also choose a movement that feels right for your body.
Press the Definitions button if you need a reminder for what likely, unlikely and impossible means.
When something is likely, it means it will probably happen.
When something is unlikely, it means it probably won’t happen.
When something is impossible, it means it can’t ever happen.
Before you begin, press the following tabs to get ready.

Literacy
Graph it!
Polkaroo and Malik did a survey about favourite drinks.
Check out the following video with Polkaroo and Malik as they show how they created a graph from their survey results.
Now it’s your turn!
Think of a question you want to ask next time you collect data. Write your question down
Example questions you could ask:
- What is your favourite toy?
- What is your favourite game?
- What is your favourite food?
You can also make up your own question.
To collect your data, survey trusted people in your learning space, if possible.
You can find pictures in flyers, magazines, newspapers, or you can draw pictures on your data sheet to create a graph.
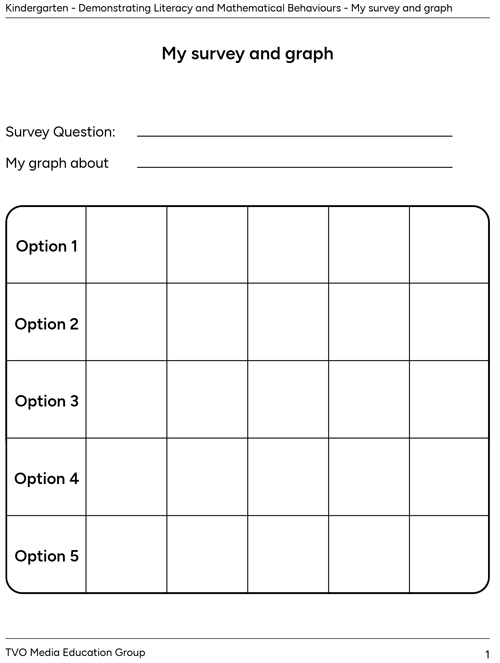
Complete the fillable and printable My Survey and Graph in your notebook or using the following document. If you would like, you can use speech-to-text or audio recording tools to record your thoughts.
What did you find out from your survey?
Record your thoughts.
Share your learning with someone else if you can.
Reflection
How do you feel about what you have learned in this activity? Press the button next to the sentence that matches how you feel.