Minds On
Textbook features
The purpose of a textbook is to inform readers about a topic. As a form of nonfiction writing, a textbook includes many features that work with the text itself to communicate meaning.
Explore the page below from the Nelson Grade 7 History textbook, which explains the 1764 Treaty of Niagara. Identify the nonfiction text features that appear on the page and describe how they might help the reader understand the text.
Record your responses using a method of your choice.
 Description
TREATY OF NIAGARA
In July 1764, more than 2000 people representing 24 First Nations and members of the British monarchy met to sign the Treaty of Niagara. Under the terms of the Treaty of Niagara, the British promised to keep settlers out of the Ohio Valley. The promises made were symbolized and preserved in the wampum belt shown in Figure 3.26. The signing of the Treaty of Niagara became known as The Great Peace of 1764.
FIGURE 3.26 The 1764 Treaty of Niagara wampum belt preserves Britain's promise to give annual gifts, in keeping with First Nations tradition, "for as long as the sun shone, and the grass grew, and the British wore red coats." Analyze: How would you interpret the symbols in the belt? There is a rectangle with a thick black border. The background of the inner rectangle is blue. From left to right, all in white, there is a chainlink, the number 17, two more chain links, two alike people standing side by side, two more chain links, the number 64 and one more chain link.
A NEW LEGAL FOUNDATION
The principles of the Royal Proclamation and the agreements woven into the Treaty of Niagara wampum belt are central to negotiations between First Nations and the Government of Canada today. Many consider these artifacts to be among Canadas first constitutional documents to guarantee Aboriginal rights. Protests like the one shown in Figure 3.27 were held across Canada starting in November 2012 to remind Canadians of agreements made hundreds of years ago.
FIGURE 3.27 On December 19. 2012, protesters in London, Ontario, marched in support of the Canada-wide ldle No More movement. Analyze: What is the main message of this photo? There is a photograph of a group of people standing behind two men holding the wampum belt. There are signs, one of which says Respect our treaty rights.
CHECK-IN
- CAUSE AND CONSEOUENCE Why did the British need to address First Nations issues after winning the Seven Years' War?
- HISTORICAL SIGNIFICANCE What is the significance of the 1764 Treaty of Niagara for First Nations? What is its significance for Canada today?
- INTERPRET AND ANALYZE What was Chief Pontiac's role in redefining relationships between Europeans and First Nations in North America?
CHAPTER 3: The Seven Years' War and the Conquest of New France: 1754-1774, pg. 93
Action
Text features in nonfiction texts
In the Minds On section, you identified a variety of text features and thought about how they help communicate meaning. Next, use the Nonfiction Text Features page to review examples of text features that are commonly found in nonfiction texts. Use the word list to label each text feature description.
Complete the Nonfiction Text Features page by using the following fillable and printable document. You can also complete this activity in your notebook or using another method.
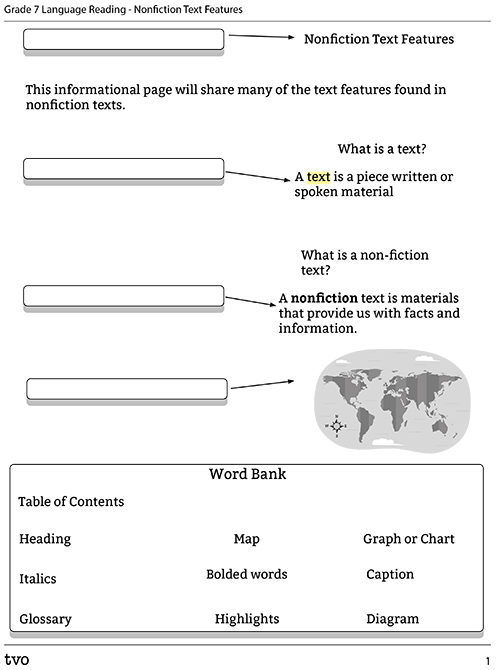
A few of the words in the word box did not appear in the image. Can you explain where these might be found in a nonfiction text and how they help learners? Record your responses in an audio recording, on paper, on a computer or in a discussion with a partner.
Press ‘Answers’ to access the answers to the Nonfiction Text Features activity.
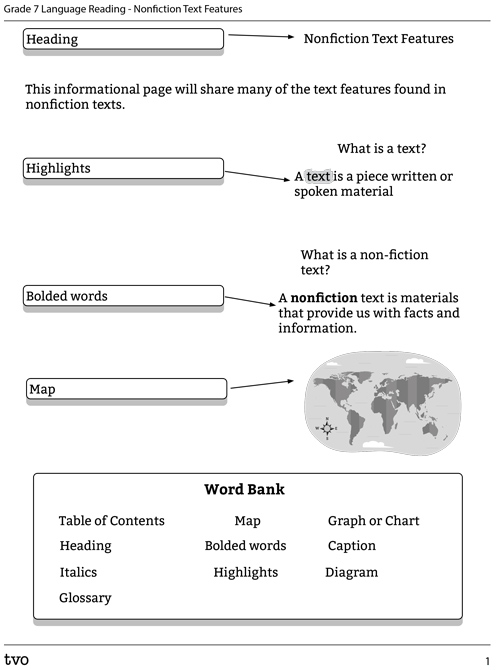
Press the Activity button to access the Nonfiction Text Features Answers.
Activity (Open PDF in a new tab)Text features in an infographic
Different types of nonfiction texts have common features. Take, for example, infographics.
Press ‘Definition’ to access the definition of infographic.
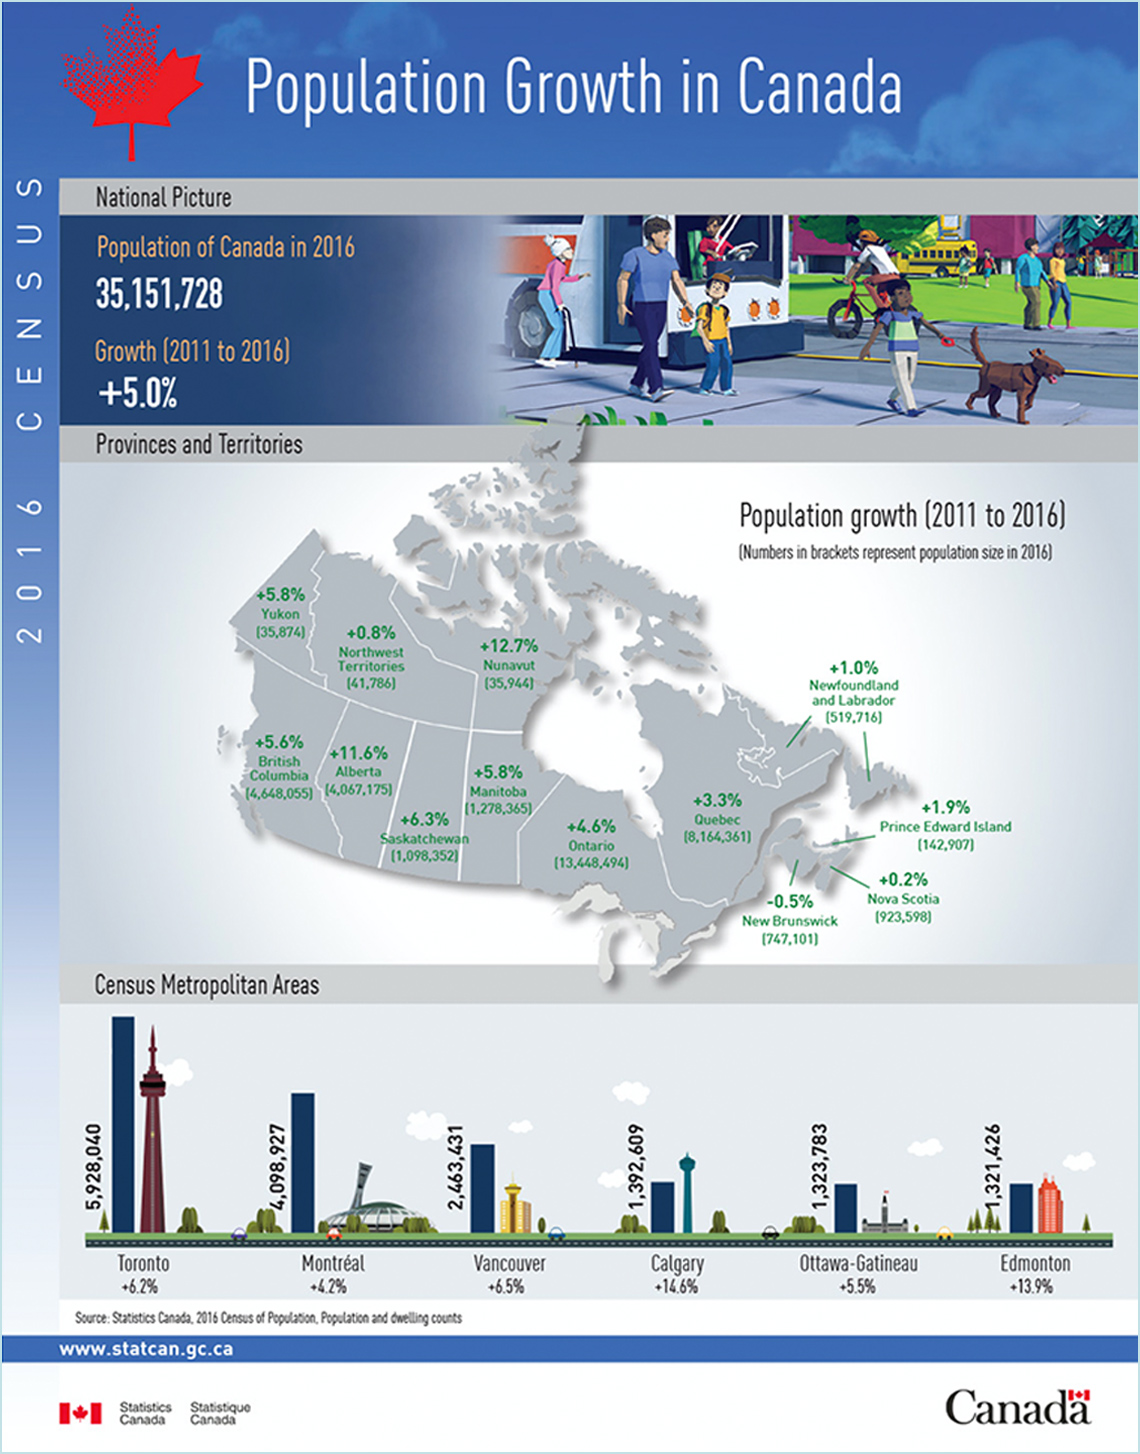
Examine the infographic from Statistics Canada below titled, “Population Growth in Canada.”
What do you notice? What do you wonder? Record your responses to the following questions in a method of your choice.
- What text features are included in this infographic from the word list above?
- What text features are included that you have never seen before?
Select two text features that you identified in the infographic and explain how they help to communicate the "story" of Canada’s population growth between 2011 and 2016.
Source: Statistics Canada. 2016 Census
DescriptionThe title is: Population Growth in Canada.
2016 Census.
National Picture:
Population of Canada in 2016: 35,151,728
Growth (2011 to 2016)
+ 5.0%
Subheading: Provinces and Territories: a map of the country of Canada with the provinces and territories as well as the population growth from 2011 to 2016.
Numbers in brackets represent population size in 2016
Yukon +5.8% (35,874)
Northwest Territories +0.8% (41,786)
Nunavut +12.7% (35,944)
British Columbia +5.6% (4,648,055)
Alberta +11.6% (4,067,175)
Saskatchewan +6.3% (1,098,352)
Manitoba +5.8% (1,278,365)
Ontario +4.6% (13,448,494)
Quebec +3.3% (8,164,361)
Newfoundland and Labrador +1.0% (519,716)
New Brunswick -0.5% (747,101)
Nova Scotia +0.2% (923,598)
Prince Edward Island +1.9% (142,907)
A bar graph with the title: Census Metropolitan Areas.
An image of the CN Tower with a bar to the left which says 5,928,040. Underneath it says Toronto: +6.2%
An image of a building in Montreal with a bar to the left that says 4,098,927. Underneath it says Montreal: +4.2%
An image of a building in Vancouver with a bar to the left that says 2,463,431. Underneath it says Vancouver: +6.5%
An image of a building in Calgary with a bar to the left that says 1,392,609. Underneath it says Calgary: +14.6%
An image of the parliament buildings in Ottawa with a bar to the left that says 1,323,786, Underneath it says Ottawa-Gatineau: +5.5%
An image of a building in Edmonton with a bar to the left that says 1,321,426, Underneath it says Edmonton: +13.9%
Source: Statistics Canada. 2016 Census
Check your thinking
Are you all done identifying the text features in the “Population Growth in Canada” infographic?
Press ‘Answers’ to access the possible text features answers to the activity.
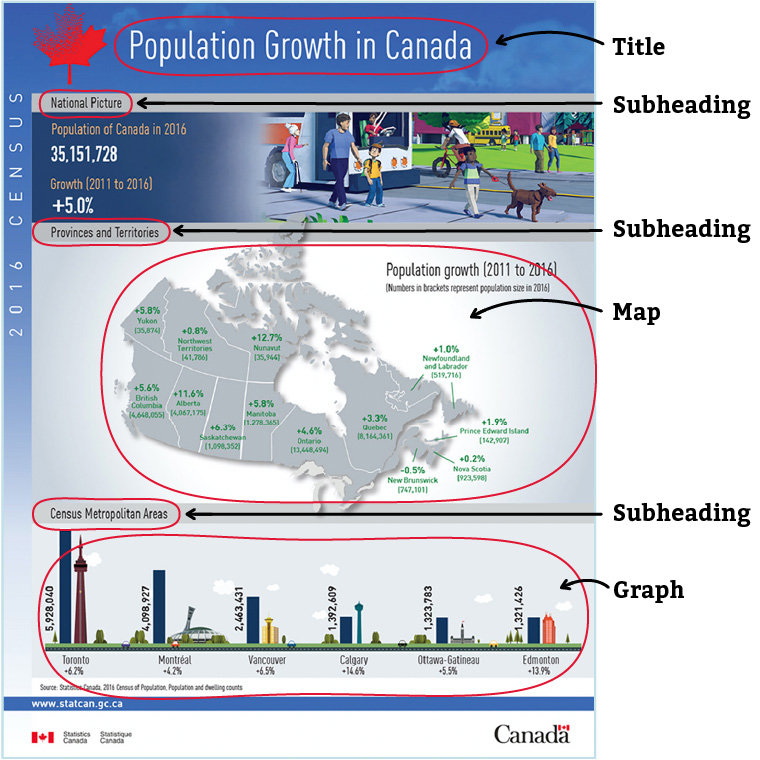
Title: identifies the topic of the text and tells us what the infographic is about. In this case, the infographic provides information about the population growth in Canada from 2011 to 2016. Subheading(s): text that appears under a title or headline, and expands on the topic of a text. The subheadings in this infographic (e.g., “National Picture,” “Provinces and Territories,” “Census Metropolitan Areas”) give the reader more specific information about the population growth in Canada from 2011 to 2016 overall, by provinces and territories, and in metropolitan areas. Map: a visual that conveys information based on location. In this case, population growth by provinces and territories from 2011 to 2016. This visual format makes it easier for the reader to engage with and understand the data. Graph: Similar to a map, a graph organizes information in a visual way and also shows relationships in the data. For example, this bar graph shows that while Toronto is Canada’s largest metropolitan area (population: 5,928,040), Calgary (population: 1,392,609) had the largest population growth between 2011 and 2016 (+14.6%).
Compare your responses to this version. Describe any additional text features that you identified.
Consolidation
Creating an information guide

How can you effectively share the information you have learned through this activity?
Create an information guide for others to use that explains nonfiction text features. It can take the form of a collage, an infographic, a poster, or a recorded message. It's up to you!
Just be sure to include an example of a nonfiction text to a) identify a variety of text features and b) explain how they help communicate meaning. You can use the textbook page from the Minds On or a section from a self-selected nonfiction text.
Reflection
As you read the following descriptions, select the one that best describes your current understanding of the learning in this activity. Press the corresponding button once you have made your choice.
I feel...
Now, expand on your ideas by recording your thoughts using a voice recorder, speech-to-text, or writing tool.
When you review your notes on this learning activity later, reflect on whether you would select a different description based on your further review of the material in this learning activity.