Minds On
Ways to express yourself: graphic texts
Have you ever tried to write something important and couldn’t find the right words? It’s like the word you wanted to say either didn’t exist or you just didn’t feel the words you had written truly conveyed what you wanted to say. Well, there’s a solution for that – pictures, more commonly known as graphics.
Sometimes graphics can convey the message more effectively than words, or can be used alongside words to make the message better understood by the reader. For example, by adding a flow chart or diagram to an article about the water cycle not only helps readers visualize what is happening, but also allows writers to express themselves more effectively.
You may have heard the saying, “a picture is worth a thousand words.”
Well, that’s what a graphic text is: a picture with or without accompanying sentences or phrases that help the writer express the ideas that they want the reader to understand.
Explore the following graphic texts, and try to figure out the message the writer is conveying.
Action
Characteristics of a graphic text
Graphic texts are different from pictures because they provide additional information to the reader. They often include titles, captions, labels, column and row headings, symbols, legends, a scale, or even a unit of measurement. They also can include a variety of fonts, colours, and labelling which can help the reader improve their understanding or be used to attract the reader’s attention.
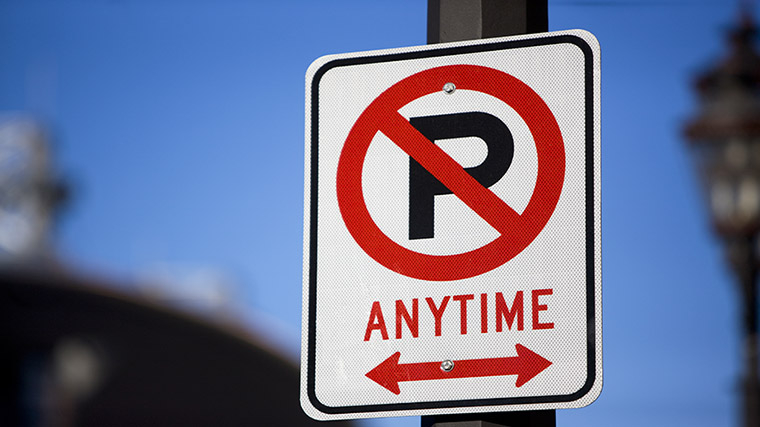
Examine the following graphic text. As you explore, consider the below:
- Explore all of the labels, and examine how they are related to the graphic. Each label has a purpose. The most important labels may be in capital letters, bold type, or a larger font.
- Follow the arrows and lines. They may be used to show movement or direction or connect to the things they name.
- Look for the use of colour or symbols to emphasize important words and information. Some graphic texts have legends or a key to explain the meaning of specific symbols and colours.
- Use the figure number, title, and keywords to find and read the related information in the text.
- Identify relationships among the visuals and information presented.
- If you are looking at a graph or chart, notice any patterns or trends that are revealed in the data.
- Explore the data that does not follow a trend, or that stands out. For example, if a graph shows a sudden increase at a particular point in time, think about what might have caused that change.
- Ask, “What is the most important information in this graphic?”
Go back and review the graphic texts at the beginning of this lesson. What do they have in common? How are they different? Create a chart comparing them to each other. Your goal is to examine as many graphic texts as possible to determine their characteristics and how writers use them to express themselves.
Alternatively, think of what kinds of pictures would relay a message in a school? In a bank? In a religious institution?
Consolidation
Create your own graphic text

Graphic texts are an increasingly popular way to share information in newspaper, magazines, textbooks, and online. These visual representations of knowledge and information are designed to make complex ideas and large amounts of data easy to understand.
Your next step, after examining several graphic texts, is to create your own.
Content
The process begins with doing research on your topic. Since this may be your first time creating a graphic text, the research will be provided for you. Your job will be to put the information together in an appealing way that teaches the reader important information.
Topic: Changes in States of Matter
Research:
- Three states of matter: solid, liquid, and gas
- Gases
- molecules are spread far apart
- molecules bounce around, full of energy
- Liquids
- liquids change shape
- molecules are close together but free to move around
- liquids flow
- Solids
- make their own shape
- shape changes if crushed or forces act upon it
- molecules tightly packed together; there’s very little movement
- Sublimation: solid to gas
- Condensation: gas to liquid
- Evaporation: liquid to gas
- Melting: solid to liquid
- Solidification: liquid to solid
Create a graphic text that presents the above information in an appealing way.
Things to consider
As you plan out your design, ask yourself and answer questions like:
- Which information, facts, and data are essential to include? Which aren’t?
- What colours and layout work best in sharing the information?
- What graphs and graphics best convey information and data to the viewer?
- What is the order, or flow, of information?
Self-assessment
When your graphic text is complete ask yourself the following questions:
- Does my graphic appeal to the reader? Does it include colour, interesting pictures, and a variety of fonts?
- Did I convey the information presented in the research so that the reader will learn something new?
- Did I proofread my graphic for spelling and grammatical errors?
- Did I use the space on the page wisely so that the information is evenly spread out and the text is a good size for the reader to see?
Example
Student Success
Think-Pair-Share
Now create a graphic text for a book you have read, something you have learned in Social Studies or Science.
Alternatively, you can create graphic text using tactile art such as plasticine/clay or an animation app.
Note to teachers: See your teacher guide for collaboration tools, ideas and suggestions.
Reflection
As you read through these descriptions, which sentence best describes how you are feeling about your understanding of this learning activity? Press the button that is beside this sentence.
I feel...
Now, record your ideas using a voice recorder, speech-to-text, or writing tool.