Minds On
Expressing inequality

Examine the following word problem:
Student A and Student B are collecting sea glass on the beach. At the end of the afternoon, they compared notes as to how much they each collected.
They found that Student A collected 3 times more sea glass than Student B. A third student (Student C) joined them and added to their collection. Student C collected half as much as Student B. Together they collected at least 18 pieces of sea glass.
How would you express the inequality in the word problem? Record ideas digitally, orally, in print, or in an organizational tool of your choice.
When you are ready, press the ‘Suggested Answer’ button to reveal a possible solution to the word problem.
We can represent this as an inequality:
Let a represent Student A, let b represent Student B, and let c represent Student C
The simplified inequality would be:
Respond
Let’s reflect on the word problem with the following questions. You can record your ideas digitally, orally, in print, or in an organizational tool of your choice.
- Could you solve for in the inequality word problem?
- What does the simplified inequality mean?
- How does it help us to know how much beach glass each of the students collected?
- How do you know when an inequality or an equation is in its simplest form?
What is important to remember when:
- simplifying inequalities?
- gathering like terms and simplifying?
Action
Graphing inequalities with one variable
In order to graph inequalities with one variable when solving for we use a number line.
This allows us to explore the possibilities for graphically.
Let’s use the inequality from the Minds On word problem as an example:
On a number line, this is graphed by drawing a red open circle over the number 4 and extending a red line from the 4 all the way to the right side of the number line with an arrow indicating that it continues to extend.
The open circle means that 4 is not included in the possibilities. We will use a number line that has 0 at the far left of the line with an arrow pointing to the left. This means that the number line grows into the negative numbers.
Numbers will increase by 1 as we go further to the right of the number line.
An arrow will appear to the right of the number 10 to indicate that the number line continues.
This number line is displayed in the following image:
Your turn
It is now your turn to graph inequality solutions. Select two of the following questions to solve and graph. You can record your solutions, including number lines, digitally, orally, in print, or using a tool of your choosing. If you’d prefer, you can use the interactive Number Line to explore these expressions.
Here is a Number Line to help you. If possible, your teacher will show you how to use the Number Line and then you can try using it yourself!
Graphing inequalities with two variables
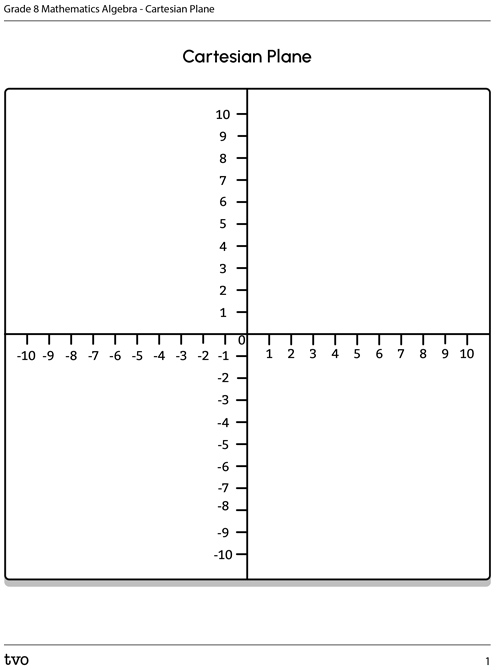
Cartesian planes
When we work with inequalities where we have two variables, such as we don’t simply use a number line. We move to a Cartesian plane.
A Cartesian plane is a 4-quadrant graph system with the point 0,0 in the center.
The following image displays the elements of a Cartesian plane.
Solving for two variables
Now that we’ve explored a Cartesian plane, let’s return to the expression
To determine how to draw the line that is needed to graph
we need to decide where to plot the numbers on the Cartesian plane.
In this case, we need to solve for both and
To do that, we will solve for each variable separately.
Solve for x and y
When solving for (called the x-intercept), we are going to make the variable a value of 0.
When we do that, we can solve for
We can use the same process to solve for (called the y-intercept) by setting the x value to 0.
|
This means |
This means |
Now we have the points for the Cartesian plane.
We will place both of these points on the Cartesian plane and then join them with a dotted line. The dotted line means that any point ON that line is not less than as it needs to be.
The following image displays the Cartesian plane with the coordinates plotted and the dotted line drawn in.
Any point that is drawn below the dotted line will be a solution to the inequality
Since the inequality is "less than" not "less than or equal to" the dotted line tells us that any point drawn ON the line will not be a solution.
Practice
Let’s test a point and determine if it is true.
Let’s use (2,0) as a test point. In this case and
correct?
Let’s substitute for and
This is true!
So, any points below this dotted line on this Cartesian plane will in fact be true!
Choose 4 points on this Cartesian plane that you believe will be true for this solution.
Test them.
Consolidation
Practise what you have learned
You are going to practise what you have learned by completing the following tasks. You can complete these tasks using a method of your choice.
Task 1
Consider the following scenario.

Ten students collected seashells at the beach. Each student collected the same number of seashells. All together they collected more than 60 seashells.
Turn the word problem into a mathematical inequality sentence and graph it on a number line in your notebook or using another method of your choice.
Task 2
Create a Cartesian Plane of your own, describe a solution on a Cartesian Plane or use the following printable Cartesian plane document to show a set of points that holds true for the following inequality:
Notice that since the inequality symbol is "greater than," the solutions will be ABOVE the dotted line. Create a test point to ensure that your work is correct.
Bringing it all together
We have learned new concepts today. We have learned about:
- how to graph inequalities with one variable
- how to graph inequalities with two variables
For each of the new concepts that you learned, let’s reflect on strengths, needs and next steps.
Complete the following tasks in an audio recording, on paper, on a computer or in an organizational tool of your choosing.
- Rank these 2 new concepts (graphing inequalities with 1 variable and graphing inequalities with 2 variables) in order of your comfort with discussing and continuing to practice with the top concept being first.
- For the new concept that you ranked at the bottom of this list, what can you do to strengthen its rankings? How can you continue to grow in your confidence for this concept?
For each of the concepts, try the following:
- Create a practice question that someone else could try (be sure to have the response ready).
- Describe how you would help them ensure that they arrive at the correct answer.
Decide which one of the reflection questions above you would use if you were able to have a conference with your teacher.
Reflection
As you read the following descriptions, select the one that best describes your current understanding of the learning in this activity. Press the corresponding button once you have made your choice.
I feel...
Now, expand on your ideas by recording your thoughts using a voice recorder, speech-to-text, or writing tool.
When you review your notes on this learning activity later, reflect on whether you would select a different description based on your further review of the material in this learning activity.