Minds On
Extrapolating data
Examine the definition for the term extrapolate:
Extrapolate
To estimate values lying outside the range of given data.
For example, to extrapolate from a graph means to estimate coordinates of points beyond those that are plotted.
How does an algebraic expression allow us to extrapolate data effectively?
Record your ideas digitally, orally, or in print.
Population growth
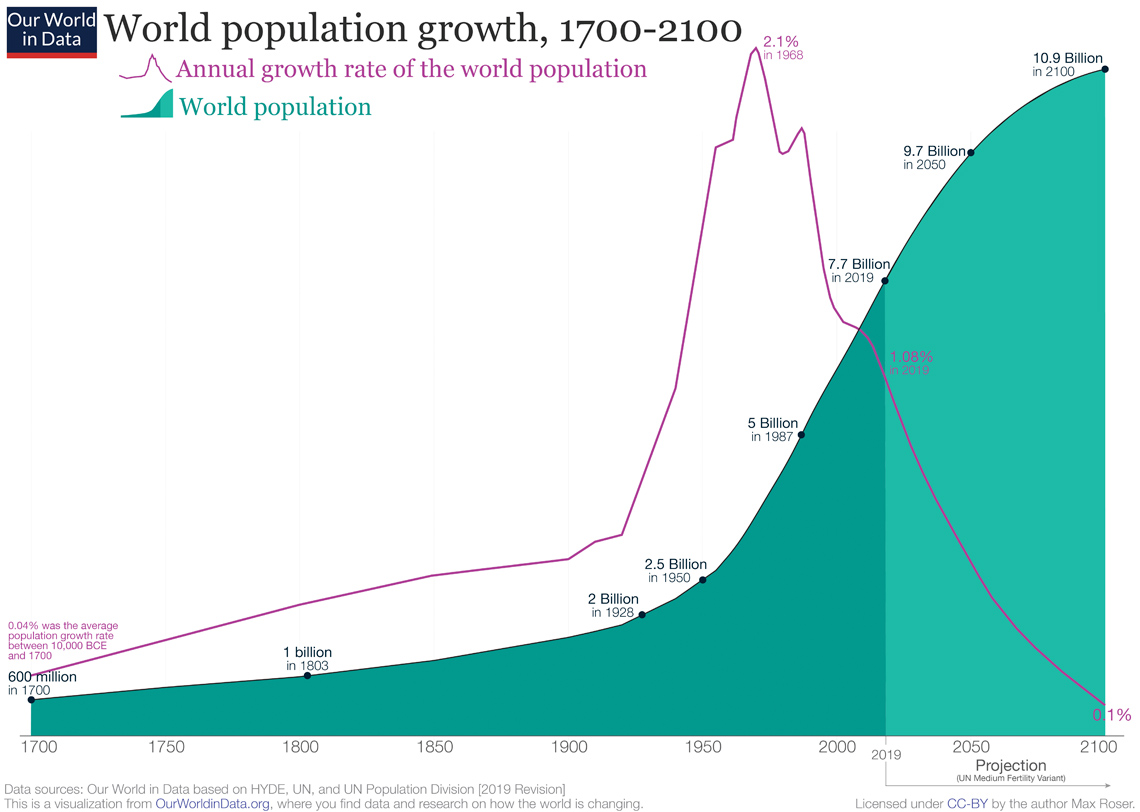
The following graph explores population growth and population predictions. The graph indicates the population of the world at various moments in history.
 Description
World population growth, 1700-2100
Table 1: World population
| Year | Population |
|---|---|
| 1700 | 600 million |
| 1803 | 1 billion |
| 1928 | 2 billion |
| 1950 | 2.5 billion |
| 1987 | 5 billion |
| 2019 | 7.7 billion |
| 2050 (projected) | 9.7 billion |
| 2100 (projected) | 10.9 billion |
Table 2: Annual growth rate of population
| Year | Growth rate |
|---|---|
| 10,000 BCE to 1700 | 0.04% |
| 1968 | 2.1% |
| 2019 | 1.08% |
| 2100 (projected) | 0.1% |
Data sources: Our World in Data based on HYDE, UN and UN Population Division [2019 Revision]
This is a visualization from OurWorldData.org, where you can find data and research on how the world is changing.
The graph displays the following true claims about world population:
- 600 million people in 1700
- 1 billion people in 1800
- 2 billion people in 1928
- 2.5 billion in 1950
- 5 billion in 1987
- 7.7 billion people in 2019
The graph makes the following predictions:
- 9.7 billion in 2050
- 10.9 billion in 2100
Your turn
Reflect on the following questions. Record your responses digitally, orally, or in print.
- What part of the graph was extrapolated?
- What trends or patterns do you notice?
- What questions do you have?
- Would this be a simple or complicated model to create? Why?
In this learning activity, you will analyze a pattern and make a prediction.
Then, you will create an algebraic expression to check your prediction.
Action
Predictions
A company has $1,000. They decide to invest it in a GIC (guaranteed investment certificate) that pays a guaranteed 5% interest for a 1-year term.
To calculate the simple interest earned you can take the decimal form of 5% (0.05) and multiply it by the amount of money invested ($1,000).
Prediction: The company decides to make the same investment for 42 years. How much total money will be saved?
How much total money will the company earn after 2 years? 3 years? 4 years? 5 years? Find the pattern and create an algebraic expression. Let y = number of years.
1,000 + 50y = Total money saved
Notice that when using the algebraic expression, we can substitute for the variable (y) and check the previous prediction.
1,000 + 50(42) = Total money saved
Task 1: Examine an expression
Examine the following table of values and algebraic expression.
| Term number | Term value |
| 1 | 1 |
| 2 | 4 |
| 3 | 7 |
The algebraic expression is: 3n − 2 where n represents the term number.
Answer the following questions about the tables of values and algebraic expression. Record your responses digitally, orally, or in print.
What is the term value when
What is the term value when
What is the term value of this pattern when
How can substituting for a variable and calculating be used to check answers and also make predictions? (or more specifically extrapolate data).
Task 2: Multiple variables
The following algebraic equations have multiple variables. Solve the algebraic equations by substituting for given variables. Record your responses digitally, orally, or in print.
- let
- let let
- let let
When you are ready, press the ‘Answer’ button to reveal the solutions to the questions.
Task 3: Using a graph to solve for unknown variables
Consider the following graph of the equation

A line graph of the equation . There are four coordinates plotted on the graph as follows: , , , . There is a straight line going through the coordinates.
Here is a partially filled in table of values for the graph:
| x | y |
|---|---|
| 0 | 3 |
| 1 | 1.5 |
| 2 | 0 |
| 3 | -1.5 |
| 4 | |
| 5 | -4.5 |
| 6 | |
| 7 | -7.5 |
| 8 |
Hint: The left-hand column is the x-coordinate and can be substituted for x in the equation. The right-hand column is the y-coordinate and can be substituted for y in the equation.
Using the information from the graph, fill in the missing y values in the tables of values.
Press ‘Answer’ to examine a completed graph based on the table of values.

A line graph of the equation . There are nine coordinates plotted on the graph as follows: , , , , , , , . There is a line going through the coordinates that is going down and to the right.
Use the equation to solve for x when y =−27.
Record your response digitally, orally, or in print.
Consolidation
Practice

Task 1
Examine the following pattern:
3, 5, 7, 9
Complete the following tasks. You can record your responses digitally, orally, or in print.
- Create the algebraic expression for this pattern. You can also ask: what is the nth term of the pattern?
- What is the 3rd term of the pattern?
- What is the 6th term of the pattern?
- What is the 52nd term of the pattern?
Task 2
Examine the following algebraic expression:
Let x = 4 and y = 1.
Solve for z. You can record your response digitally, orally, or in print.
Bringing it all together
- What is one thing you consider important to remember about solving for unknowns using variables, graphs and information in tables of values? Why?
- Are there any tips or strategies you would share with someone else who is just learning?
- Is there an area you would like to continue to practice or a skill you would like to further develop regarding solving for unknowns?
Reflection
As you read the following descriptions, select the one that best describes your current understanding of the learning in this activity. Press the corresponding button once you have made your choice.
I feel...
Now, expand on your ideas by recording your thoughts using a voice recorder, speech-to-text, or writing tool.
When you review your notes on this learning activity later, reflect on whether you would select a different description based on your further review of the material in this learning activity.