Minds On
Explore
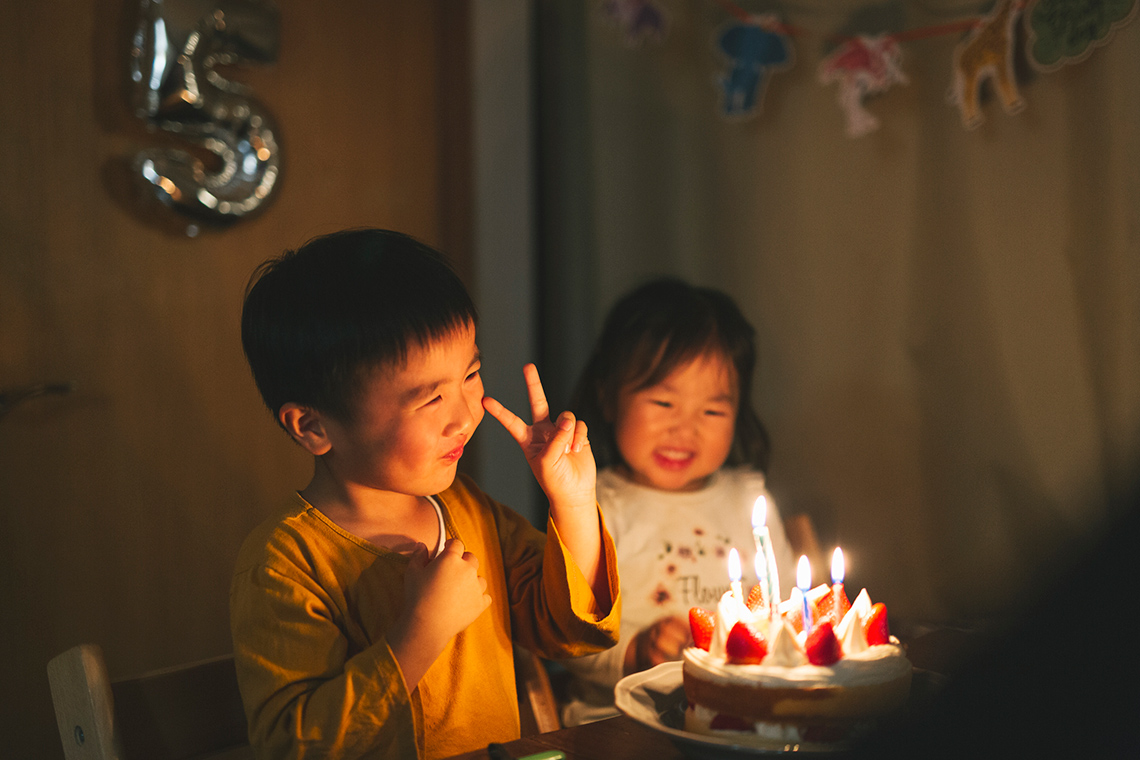
Do you think it is possible that two people in a class or group will have the same birth date?
Explore this video entitled “Birthday Probability” to learn more about probability and likelihood of 2 people having the same birth date.
Student Success
Think
Reflect on the following questions:
- Did two people have the same birth date?
- Who had the same birth date? What date is it?
Note to teachers: See your teacher guide for collaboration tools, ideas and suggestions.
Action
Predictions
Probability is another way of saying how likely something is to happen.
In the video "Birthday Probability," Eric told us that his family had 23 people in total.
He wondered, “how many people will have the same birthdate?” Next, Eric made a prediction.
A prediction is a guess about what might happen.
Finally, Eric checked his prediction to find that two people in his family have the same birthdate.
Eric can use his tally chart or data to make a prediction about another group of 23 people. He might predict that it is also very likely that two people would have the same birthdate in that group.
In order to understand probability, we use collect data and make predictions.
Task 1: Gather data
A student asked Miss Cherry’s class of 20 students, “What month were you born in?”
Here are the results in a tally table. Each tally mark represents one (1) student.
| Month | Number of Students |
|---|---|
|
January |
|
|
February |
|
|
March |
|
|
April |
|
|
May |
|
|
June |
|
|
July |
|
|
August |
|
|
September |
|
|
October |
|
|
November |
|
|
December |
Task 2: Make a prediction
Use the data from Miss Cherry’s class tally table, to make a prediction about another group of students.
Record your predictions for the other group of students on the computer, on paper, or in a recording.
Press ‘Show results’ to reveal possible predictions.
Task 3: Test a prediction
Test your prediction by exploring the data below. This tally table is a record of another class and their birth dates.
This time, a student asked Mr. Anderson’s class of 20 students, “What month were you born in?”
Here are the results in a tally table. Each tally mark represents one (1) student.
| Month | Number of Students |
|---|---|
| January | |
| February | |
| March | |
| April | |
| May | |
| June | |
| July | |
| August | |
| September | |
| October | |
| November | |
| December |
Brainstorm
What do you think?
Reflect on your predictions for the other class from “Task 2: Make a prediction” section.
Use your predictions and Mr. Anderson’s tally table to test if your prediction was correct!
Why do you think the prediction was correct or incorrect?
Consolidation
Favourite seasons
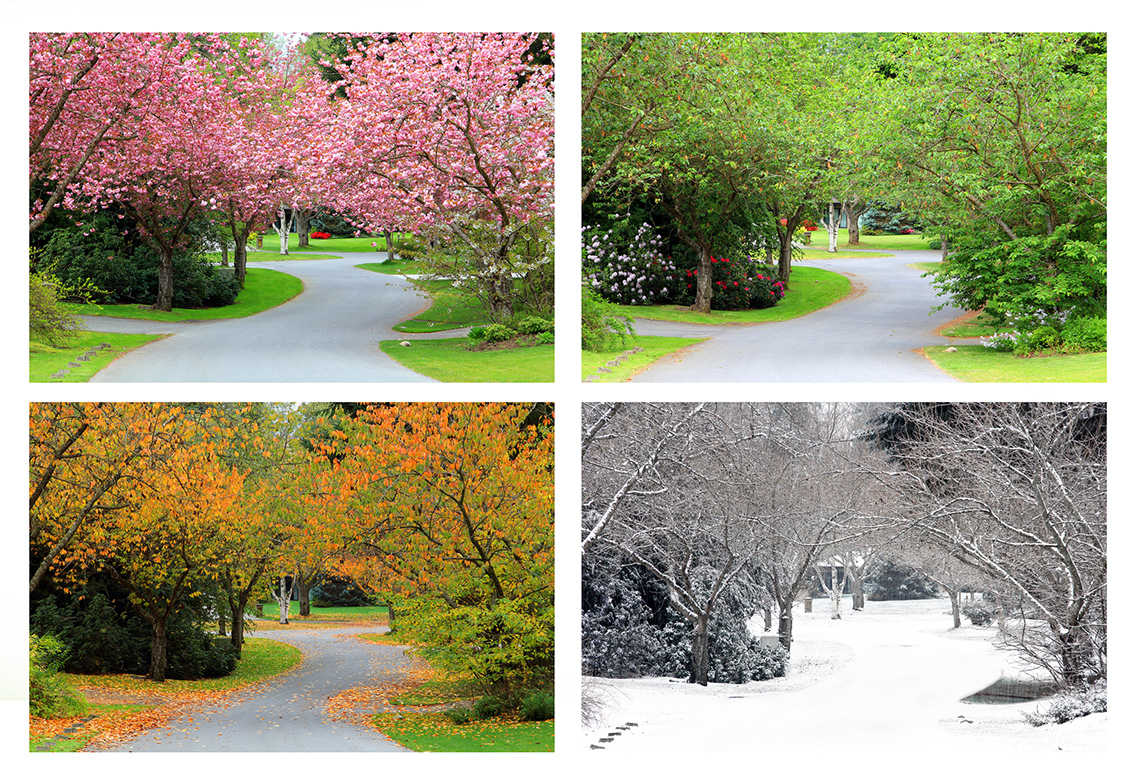
Use the following data from Class A to make a prediction about another group, Class B.
A student asked a class of 20 students, “What is your favourite season?”
Here are the results of Class A in a tally table. Each tally mark represents one (1) student.
| Seasons | Number of Students |
| Winter | |
| Summer | |
| Spring | |
| Fall |
Task 1: Make a prediction
Use this data to make a prediction about Class B.
Here are some sentence starters to help you make your prediction:
- I predict that…
- I think the Class B will…
- The Class B might…
- My prediction is that Class B will…
Record your prediction on the computer, on paper, or in a recording.
Task 2: Test your prediction
The results of Class B are recorded in a tally table. Each tally mark represents one (1) student.
| Seasons | Number of Students |
| Winter | |
| Summer | |
| Spring | |
| Fall |
Brainstorm
What do you think?
- Were your predictions correct?
- Why do you think that is?
Reflection
How do you feel about what you have learned in this activity? Which of the next four sentences best matches how you are feeling about your learning? Press the button that is beside this sentence.
I feel…
Now, record your ideas about your feelings using a voice recorder, speech-to-text, or writing tool.