Minds On
Explore
Explore this video entitled “Pictographs” to learn more about pictographs.
Test Your Skills!
Test your skills
What do you notice about pictographs in the video?
For each sentence, select the missing word from the drop-down menu.
Action
Pictographs
We can use a tally chart to make a graph.
| Kinds of Flowers | Number of Flowers |
|---|---|
| Tulips | |
| Roses | |
| Pansies | |
| Bluebells | |
| Lilies |
This is a tally table of the pictograph below. The title is Flowers in the Garden. The labels along the bottom include the different types of flowers: Tulips, Roses, Pansies, Bluebells, and Lilies. Each tally mark from the tally table is now one flower on the pictograph. Tulips: 2 flowers. Roses: 3 flowers, Pansies: 1 flower, Bluebells: 6 flowers, Lilies: 4 flowers. One image of a flower is equal to one flower.
The question for this tally table is “What flowers are in the garden?.”
That means, the title for our graph will be “Flowers in the Garden.”
The title goes at the top, and the names of the different types of flowers (tulips, roses, pansies, bluebells, and lilies) will go at the bottom.
Now that we have the data or information, we can create a pictograph.
Each tally mark makes one flower in the pictograph.
Brainstorm
What do you think?
Count the number of flowers in the “tulip” column.
Next, count the number of tallies for tulips in the tally table.
Do the numbers match?
Your turn!
A horse loves to eat apples. The stable owner wanted to know how many apples they should buy each week.
The stable owner decided to record how many apples the horse ate each day for a week.
They created the pictograph below:
Understanding the pictograph
Select the correct answer.
Consolidation
Making my pictograph

Create your own pictograph, by using the data in the tally table below.
| What was the weather this month? | Number of days |
|---|---|
| Sunny | |
| Cloudy | |
| Snowy | |
| Rainy | |
| Mix of Sun and Clouds |
This is a tally table. The first column is labelled ‘What was the weather this month?’ The types of weather include: Sunny, Cloudy, Snowy, Rainy, Mix of Sun and Clouds. The second column is labelled ‘Number of Days.’ Each tally equals one day. The tallies for each type of weather include: Sunny- 4 tallies, Cloudy- 7 tallies, Snowy- 5 tallies, Rainy- 2 tallies, Mix of Sun and Clouds- 8 tallies.
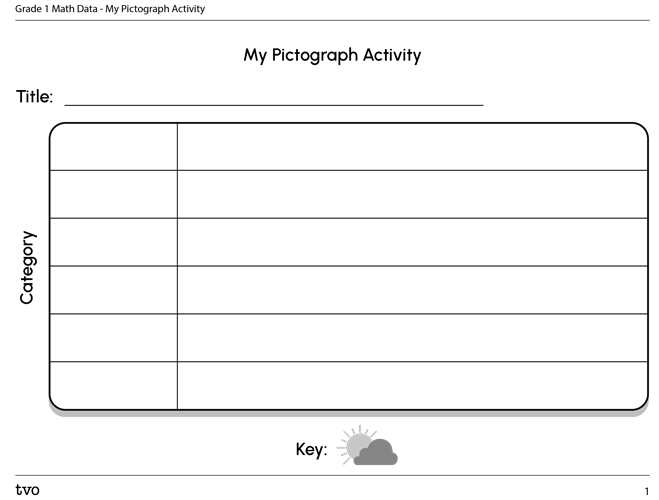
Your graph must have a title and labels.
You can create your graph by using the pictograph template below.
Complete the My Pictograph Activity in your notebook or using the following fillable and printable document.
Reflection
How do you feel about what you have learned in this activity? Which of the next four sentences best matches how you are feeling about your learning? Press the button that is beside this sentence.
I feel…
Now, record your ideas about your feelings using a voice recorder, speech-to-text, or writing tool.
