Minds On
Organizing data
Data can be organized and displayed in different ways. Let’s explore two different ways to display a set of data about a group of animals. The animals are: a lion, a seahorse, a frog, a cat, a whale, a goldfish, a penguin, and a dog.

The animals have been sorted in to the following Venn diagram.
Where would you place the mouse, turtle and crocodile?

You can record your answers in the printable and fillable Animals Venn Diagram, in your notebook, use a voice recorder, or any other method of your choice. Reflect on why you made those choices.

Now let’s explore a different way to organize the same data.
What do you notice about the table? How is it similar to the Venn diagram? How is it different?
| Animals that Live on Land | Animals that Live in the Water | Animals that Live Both on Land and in the Water |
|---|---|---|
|
lion dog cat |
goldfish seahorse whale |
frog penguin |
Where would you place the following animals in the table?
- crocodile
- turtle
- mouse
You can use the following fillable and printable Animals Table to record your answers. You can also use your notebook, a voice recorder, or any other method of your choice.
Press the ‘Activity’ button to access Animals Table.
Action
Venn diagrams
One way data can be sorted and organized is using a Venn diagram. It is used to sort items by an attribute using two circles that overlap. An attribute is a trait or characteristic of an item. In the list of animals that follows, the attribute used for sorting is where the animals live.
A Venn diagram includes:
- A title
- Two circles that overlap with a section in the middle (this is the “both” section)
- A title for each circle; the title is the attribute that is being used to sort the data. Here the animals are sorted by where they live – on land or in the water. The middle section is where to place the animals that live in the water AND on land.
Tables
We can also use tables to sort and organize sets of data. A table has columns to divide the data.
A table includes:
- A title
- Columns that sort and organize the data by attribute
- A title for each column
| Animals that Live on Land | Animals that Live in the Water | Animals that Live Both on Land and in the Water |
|---|---|---|
|
lion dog cat |
goldfish seahorse whale |
frog penguin |
Let’s sort a different set of data!
Favourite foods
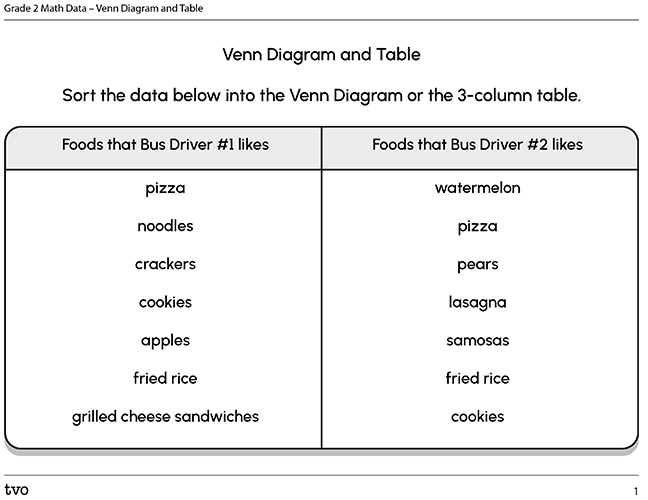
Two bus drivers were asked this question: “What are your favourite foods?”
Examine the data collected below:

| Foods that Bus Driver #1 likes | Foods that Bus Driver #2 likes |
|---|---|
|
|
Sort the data using a specific attribute. Here are some ideas: is a fruit, dessert or is it hot? There are lots of ways to sort the data. What attribute will you use?
Then, organize this data into a Venn diagram or a three-columned table. Be sure to examine the data carefully. What do you notice?
What is something that both Bus Driver #1 and Bus Driver #2 would eat for lunch?
Record your answers in the Venn Diagram and Table fillable and printable document, in your notebook, or use a voice recorder.
Consolidation
Independent task
Researchers have sorted different wildlife into categories including animals with long ears, long tails, as well as both long ears and long tails.
Here are the animals that were sorted:
- hare
- fennec fox
- kangaroo
- galagos (also known as bush babies)
- long eared jerboa
- spider monkey
- ring tailed lemur
- basset hound (dog)

Hare
A hare is an animal which people thought was a rabbit because they appear very similar to them. Hares generally have longer ears and are longer in size than rabbits.

Fennec Fox
Fennec foxes are one of the smallest breeds of fox. They have large ears and bushy tails. They are light beige in colour.

Kangaroo
Kangaroos are large marsupials (they have a pouch to carry their babies). The colour of their fur is red, brown, or gray and they have a cream-colored belly. They have long, muscular tails, short front paws and long rear legs.

Galagos (Bush Baby)
Galagos, also called bush babies, are primates. They are gray, brown, or reddish, with large eyes and ears, long hind legs, soft fur, and long tails.

Long Eared Jerboa
The Long-Eared Jerboa is a rodent that has similar qualities to a mouse. They have long ears, legs and a tail. Their bodies appear much like a common mouse.

Spider Monkey
Spider monkeys have long limbs. They weigh up to 20 pounds and have thin dangling limbs. Their tail is also very long and they can pick items up with their tail.

Ring Tailed Lemur
Ring Tailed lemurs have long bushy tails that have alternating black and white bands around it. Their fur color can be a light reddish gray or a dark red-brown on their bodies but have light gray to gray-brown limbs. Their faces are white with dark brown or black marks around their eyes. Their ears are white and pointy.

Basset Hound (dog)
Basset Hounds are a breed of dog that has short legs and a long, heavy body. They have long ears and large eyes. They have a white spotted belly with brown and black markings on their bodies.
Sorting animals
How can you sort the data about the animals using a Venn diagram, a table, or a method of your choice?
Record your answers in your notebook or use a voice recorder.
Reflection
How do you feel about what you have learned in this activity? Which of the next four sentences best matches how you are feeling about your learning? Press the button that is beside this sentence.
I feel…
Now, record your ideas about your feelings using a voice recorder, speech-to-text, or writing tool.
Press ‘Discover More’ to extend your skills.
Discover MoreCreate your own sorting activity. Sort items into the chart provided in the fillable and printable Template for Recording Thinking and Responses below or use a method of your choice to record your data. What did you notice about the data?
Press the Activity button to access Template for Recording Thinking and Responses.
Activity (Open PDF in a new tab)