Minds On
Bar graphs
A toy store manager asked his customers about their favourite types of toys and graphed the results. Examine the graph below. What do you notice?
Press the ‘Questions’ button for questions to guide your exploration of the graph.
- Does the graph have a data source?
- Does the graph have a title?
- Does the graph have labels?
- What does the graph tell us? Is there any information missing from the graph?
Record your thoughts using a method of your choice.
Action
What's missing
In the Minds On section, we explored a bar graph. We noticed that the graph was missing information.
Let’s review what a bar graph is and the elements of a bar graph.
What is a bar graph?
A bar graph uses horizontal or vertical bars to compare different categories of data. The length of each bar represents a number. There are gaps or spaces between the bars to separate different categories of data.
Elements of a bar graph
Graphs are a useful way to display data. But without a source, title, and labels, a graph will not make sense. Here’s what a bar graph needs:
- A data set: This is the information that will be displayed on the graph.
- Source: where the data was collected
- Title: introduces the data in the graph
- Labels: provide extra information such as labels for the x-axis along the bottom of the graph and the y-axis along the side (up and down). For example, in the bar graph below, the categories represented by each bar are labelled
What’s missing?
Let’s return to the bar graph from the Minds On.
Use what you’ve learned about the elements of a bar graph to identify the missing elements in the toy store manager’s bar graph.
Click on the ‘Answer’ to reveal the result.
This graph does not have a title. The y-axis is labelled, Number of customers, but the x-axis does not have a label. The y-axis starts at 0 and goes up by ones to 7.
The types of toys on the x-axis are, action figures, dolls, puzzles, stuffed animals, robotic toys, other.
3 people selected action figures as their favourite type of toy, 4 people selected dolls, 3 people selected puzzles, 2 people selected stuffed animals, 6 people selected robotic toys, and 5 people selected other.
Create a bar graph
A gardener asked 24 people what their favourite season is. Explore the data collected in the tally chart below.
| Season | Tally | Total |
|---|---|---|
| Spring | 4 | |
| Summer | 7 | |
| Fall | 4 | |
| Winter | 9 |
Once you have examined the data organized in the table, use it to create a bar graph.
Your graph should include:
- a data source
- a title
- labels for your x-axis (left to right) and y-axis (up and down)
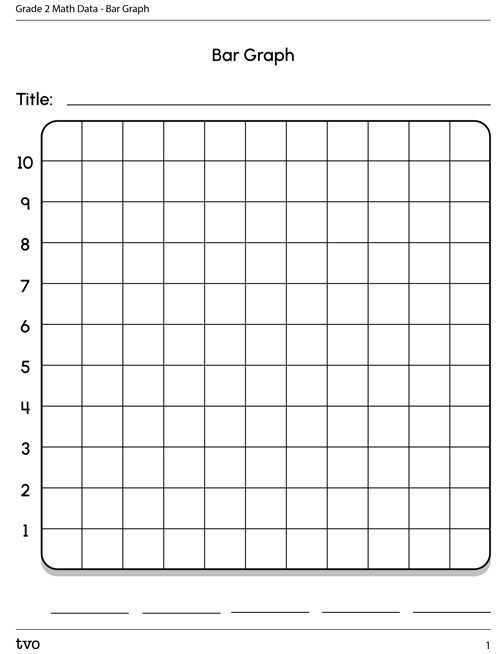
You can use paper, a computer, concrete materials, a recording to describe your graph, or the graph printable Bar Graph.
An 11 by 11 grid template for a bar graph with space above to record a title. The x-axis has 5 spaces to record bar labels. The y-axis starts at 0 and increases by ones to 10.
Use the following questions to reflect on the graph that you created. You can type, write, use speech to text, or audio record your responses.
- What does the graph tell you?
- Why is it important for a graph to have a data source, title, and labels?
Consolidation
Bar graphs to tally charts
A Grade 2 student asked 20 students in their class what month they were born in. They collected the data in a tally chart and graphed the data in a horizontal bar graph.
Examine the horizontal bar graph below.
Then, use the data from the bar graph to create a tally table.
You can create your tally table using the Bar Graph to Tally Table printable document, on paper, on a computer, using concrete materials, or as descriptions in a recording.
| Months of the Year | Number of Students |
|---|---|
Press the ‘Activity’ button to access Bar Graph to Tally Table.
Think about your learning
Use the following questions to reflect on your learning. You can record your responses using a method of your choice.
- Is it easier to explore data in a tally table or a bar graph?
- What do bar graphs tell us?
- What are the benefits of a bar graph?
Reflection
How do you feel about what you have learned in this activity? Which of the next four sentences best matches how you are feeling about your learning? Press the button that is beside this sentence.
I feel…
Now, record your ideas about your feelings using a voice recorder, speech-to-text, or writing tool.
