Minds On
What do the mean, median, and mode tell us about data?
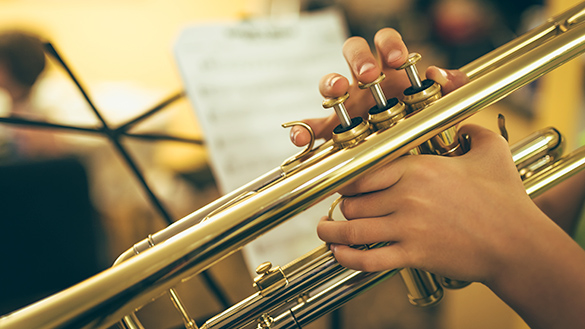
A trumpet player recorded the number of minutes they practiced the trumpet on six of the seven days last week. These are the three measures of central tendency (mean, median and mode) of their data set:
| Mean: 20 minutes | Median: 15 minutes | Mode: 15 minutes |
Consider the following question:
- What can you say about the trumpet player’s practicing habits based on the mean, median, and mode of their data set?
Throughout this learning activity, you can record your thoughts digitally, orally, or in print.

Press ‘Trumpet Practice Data Set’ to reveal a table that represents the number of minutes the trumpet player practiced last week.
| Sunday | 25 minutes |
| Monday | 30 minutes |
| Tuesday | 15 minutes |
| Wednesday | 15 minutes |
| Thursday | 15 minutes |
| Friday | 20 minutes |
| Saturday | 0 minutes |
| Total trumpet practice last week: 120 minutes |
Action
Analyzing measures of central tendency
Brainstorm
Thinking about measures of central tendency
Recall your response to the question from our Minds On activity.
Using the tool of your choice, answer the following question:
- Which measure of central tendency best describes the trumpet player’s practice habits: the mean, the median, or the mode?

The jumping distance of rabbits
The following set of data represents the distances that randomly selected rabbits can jump:
| 102 cm, 128 cm, 129 cm, 131 cm, 132 cm, 135 cm, 134 cm, 129 cm, 168 cm |
Determine the mean and median, and identify the mode of this data set.
Next, remove the smallest and largest data values from the data set and determine the mean and median, and identify the mode again.
Reflect on your results by answering the following questions:
- How did changing the data set affect the mean, median, and mode?
- How does removing outliers (the smallest and largest data values) affect the measures of central tendency?
- If a rabbit owner wanted to prove that their group of rabbits can jump a far distance, which measure of central tendency should they use to represent their data? Explain why.

Press ‘Answers’ to reveal the solutions.
Mean: Find the sum of all the numbers and then divide by the number of numbers.
102 + 128 + 129 + 131 + 132 + 135 + 134 + 129 + 168 = 1,188 cm
Sum divided by number of numbers - 1188 ÷ 9 = 132 cm.
The mean is 132cm.
Median: Middle number when numbers are ordered from least to greatest.
102, 128, 129, 129, 131, 132, 134, 135, 168
The median is 131.
Mode: The number that occurs the most often in a set.
The mode in this set is 129.
Remove the smallest number: 102 and the largest number: 168.
Mean: Find the sum of all the numbers and then divide by the number of numbers
128 + 129 + 131 + 132 + 135 + 134 + 129= 918 cm
Sum divided by number of numbers - 918 ÷ 7 = 131cm.
The mean is about 131 cm.
Median: Middle number when numbers are ordered from least to greatest.
128, 129, 129, 131, 132, 134, 135
There are two middle numbers so we find the midpoint between them by adding them together and dividing by two.
The median is 131.
Mode: The number that occurs the most often in a set.
The mode in this set is still 129.
Removing the outliers didn’t change the mean, median and mode too much. But it does mean the means of central tendancy are no longer accurate since the outliers were a part of the data set.
When we remove the outliers (the numbers that are really far off on either (or both) ends, you are left with a set of numbers that are closer together. Without the outliers, the centre of the data is not always the same.
I think I would use the median because it is the middle jump distance, with the same number of jumps above it and the same number below it. This way if my rabbits jump farther than the median, they are jumping farther than at least half of the rabbits.
Consolidation
Collecting data and drawing conclusions
Using the research tool of your choice, find a data set that has at least nine values. For example, the temperature of the last nine days, or the number of points scored by a sports team during their last nine games.
Record your responses to the following questions about your data set, using a method of your choice:
- What is the mean?
- What is the median?
- What is the mode?
- Which measure of central tendency best represents your data set?

Student Success
Think Pair Share
If possible, discuss the following question with a partner:
- What measure of central tendency would you use if a data set contains unusually small or unusually large outliers compared to the rest of the data?
Note to teachers: See your teacher guide for collaboration tools, ideas and suggestions.
Reflection
As you read through these descriptions, which sentence best describes how you are feeling about your understanding of this learning activity? Press the button that is beside this sentence.
I feel…
Now, record your ideas using a voice recorder, speech-to-text, or writing tool.
Connect with a TVO Mathify tutor
Think of TVO Mathify as your own personalized math coach, here to support your learning at home. Press ‘TVO Mathify’ to connect with an Ontario Certified Teacher math tutor of your choice. You will need a TVO Mathify login to access this resource.
TVO Mathify (Opens in a new tab)