Minds On
Examining a set of data
What conclusions can we make from the mean, median, and mode of a data set?

Use the following questions to explore a set of data that represents the number of cupcakes sold at a bakery to nine customers. Throughout this learning activity, you can record your thoughts digitally, orally, or in print.
- The mean number of cupcakes sold is nine.
- The median number of cupcakes sold is seven. Knowing only this information, what conclusions can you make?
- The mode of the cupcakes sold is two. Knowing only this information, what conclusions can you make?
Now that you have the mean, median, and mode of the data set you explored in the previous section, check out the following list of cupcakes sold at the bakery:
2, 2, 2, 3, 7, 8, 14, 17, 26
- Does the actual data match some of the conclusions you made using the mean, median and mode?
- What does this tell us about the measures of central tendency and how they can tell the story of the data?
Action
Task 1: Let’s reflect

Review the data from the Minds On. Which measure of central tendency is the most appropriate measure used to describe the data? Explain your thoughts.
Task 2: What is an outlier?

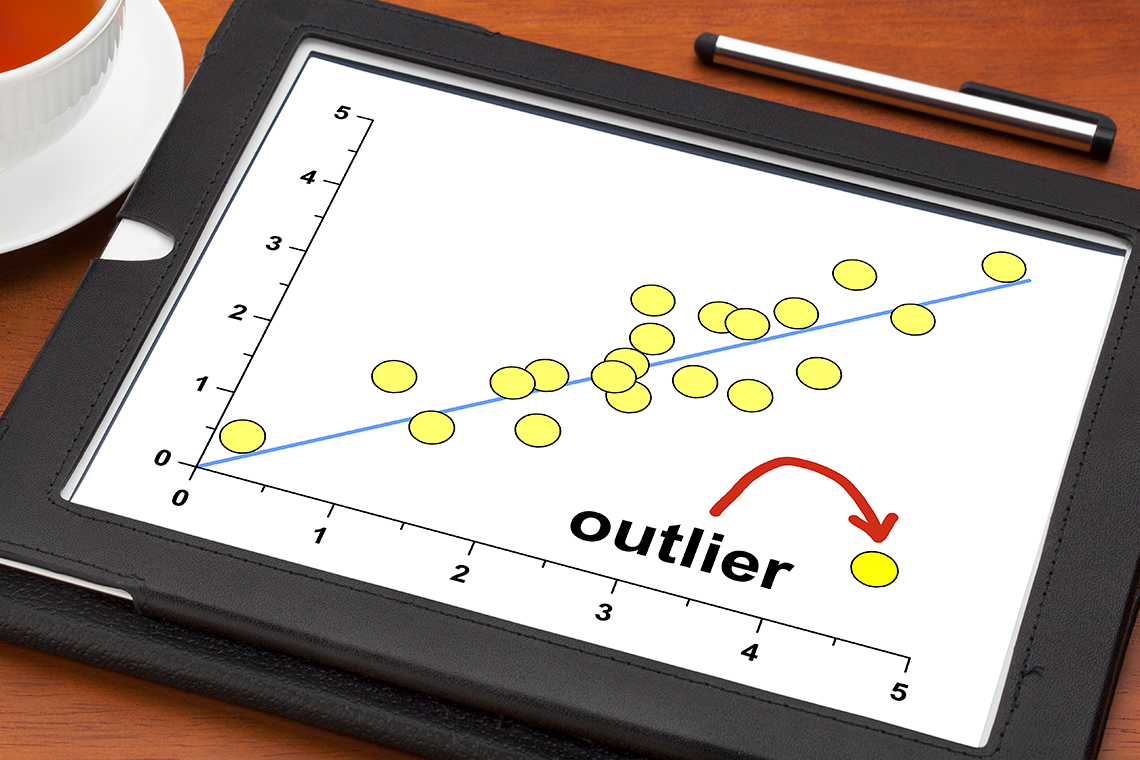
A data value or a data point that exists outside the overall pattern of the data is called an outlier. It’s important to identify potential outliers because they can influence the mean, median, and mode
Let’s explore how outliers can affect a data set.
Let’s go shopping
Examine the following data set. The amounts represent the cost of the items purchased at a store over a one hour time period.
$9.00, $9.50, $15.50, $15.50, $20.50, $29.00, $89.25
Respond to the following prompts to explore how an outlier can affect a data set.
- Determine the mean, median, and mode of this data. Record your responses using a method of your choice.
- Notice that the outlier in the data is $89.25. It is an outlier because it is so much higher than the other amounts. Eliminate the outlier and calculate the mean, median, and mode again.
- Describe how the mean, median, and mode changed when you removed the outlier. Record your thoughts.
Outliers affect the mean value of the data but have little effect on the median or mode of a given set of data.
Press ‘Answers’ to reveal the sample solutions.
- The mean of the data set is $26.89 - the sum ($188.25) divided by the number of numbers (7).
- The median of the data set is $15.50.
- The mode of the data set is $15.50.
- If the outlier is removed, the data set would be: $9.00, $9.50, $15.50, $15.50, $20.50, $29.00
- The mean would be the sum ($99) divided by the number of numbers (6). The mean is $16.50.
- The median of the new set would be $15.50.
- The mode would be $15.50.
- The median and mode didn’t change when I removed the outlier. The mean became a value that was more like the other numbers in the set and more like the median and the mode. Before, the mean was way off the other measures of central tendency and was even higher than almost all the values in the data set, except the largest value.
Extend your understanding
If the store owner wants to get an idea of how much money was spent over that one-hour period, what would the most appropriate measure of central tendency be, the mean, the median or the mode? Explain your thoughts.
Consolidation
Task 1: Reflect and connect

Use the following questions to reflect on your learning.
Explain your thoughts and record your responses using a method of your choice.
- Does mean, median, or mode always represent the data in the most appropriate way?
- When might median be a more appropriate measure than mean?
- If you were making conclusions about numerical data, which would you try to find first: mean, median, or mode?
Task 2: Collect data and make conclusions
- Research and find a data set that contains at least ten values (e.g., sports data, sales data, etc.)
- Determine the mean, median, and mode of this data set.
- Determine which measure of central tendency best represents your data set.
Reflection
As you read through these descriptions, which sentence best describes how you are feeling about your understanding of this learning activity? Press the button that is beside this sentence.
I feel…
Now, record your ideas using a voice recorder, speech-to-text, or writing tool.
Discover MoreIndependent practice
Complete the Data Set Worksheet in your notebook or using the following fillable and printable document.
Press the ‘Activity’ button to access the Data Set Worksheet.
Connect with a TVO Mathify tutor
Think of TVO Mathify as your own personalized math coach, here to support your learning at home. Press ‘TVO Mathify’ to connect with an Ontario Certified Teacher math tutor of your choice. You will need a TVO Mathify login to access this resource.
TVO Mathify (Opens in a new tab)