Minds On
Probability
Probability is the chance that something will happen. It can be recorded on a line. This is a probability line which ranges from 0 to 1.

A probability line shows the word “Impossible” and a red prohibition sign at 0. Next, the word “unlikely” is accompanied with an image of a dice displaying the number 4 and “1-in-6 Chance”. In the middle, the words “Even Chance” is paired with an image of a coin being flipped. Then comes the word “Likely” accompanied with an image of 5 balls, where 4 are purple and 1 is red and the words, and “4-in-5 Chance”. The line ends with the word “Certain” accompanied with a thumbs up sign with the number 1.
The probability of an event occurring is somewhere between impossible and certain.
As well as words, we can use numbers to record the probability of something happening:
- Impossible is zero.
- Certain is one.
How would the probability line be labelled if we were calculating probability as a fraction?
Press ‘Answer’ to reveal the solution.
Between 0 and 1, the fractions
would appear on the line in increasing order.
How would the probability line be labelled if we were calculating probability as a percent?
Press ‘Answer’ to reveal the solution.
The probability line ranges from 0% to 100%. The percentages 16.66…%, 25%, 50%, 75%, 80%, and 100% would be positioned across the line in increasing order.
How would the probability line be labelled if we were calculating probability as a decimal?
Press ‘Answer’ to reveal the solution.
A probability line ranges from 0 to 1. The decimals 0.166…, 0.25, 0.5, 0.75, 0.8, and 1 would be positioned across the line in increasing order.
Brainstorm
Names on probability line
Where would you place names like “fair chance,” “remote chance,” “possible,” “probable,” and “improbable” on the probability line?
Throughout this learning activity, you can record your ideas digitally, orally, or in print.
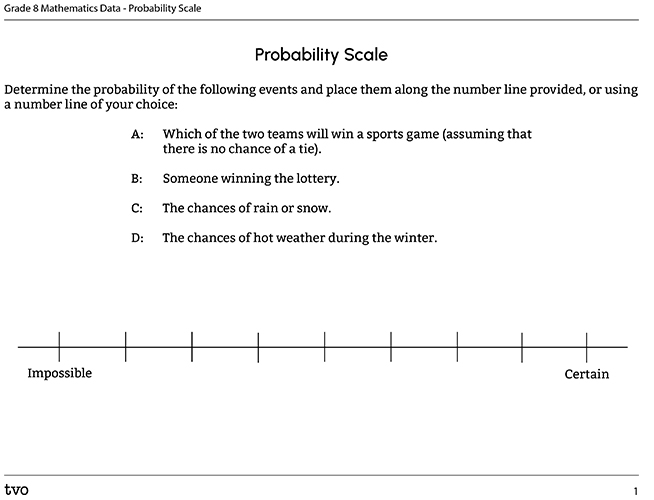
Using any of the probability scales above, determine the probability of the following events and place them along the probability line provided in the document Probability Scale, or using a probability line of your choice:
- A: Which two teams will win a sports game (assuming that there is no chance of a tie).
- B: Someone winning the lottery.
- C: The chances of rain or snow.
- D: The chances of hot weather during the winter.
Action
Task 1: Mutually exclusive events
Mutually exclusive events are events that cannot happen at the same time.
Examples of mutually exclusive events:
- When it is very hot outside during the summer, it usually does not snow. Snow and hot weather are mutually exclusive.
- When one team wins a baseball game and, at the same park, a team wins a soccer game. The baseball game and soccer game are not mutually exclusive.
Explore the following two Venn diagrams.
The first is titled “Mutually Exclusive Events,” and shows two circles labelled A and B. The circles are separate from one another.
The second is titled “Non-Mutually Exclusive Events,” and shows two circles labelled A and B too. However, the circles are overlapping in the middle to create a shared space.
In order to use Venn diagrams when referring to events, imagine there are two events: Event A and Event B. If they both cannot happen at the same time, then A and B are mutually exclusive.
Your Turn!
Are these two events mutually exclusive (if they both cannot happen at the same time, then they are mutually exclusive)?
Press the button ‘Answer’ to check if you are correct.
- Selecting a penny or a dime from 4 pennies, 3 nickels, and 6 dimes.
Non-mutually exclusive
- Having it rain and snow at the same time.
Mutually exclusive
Task 2: Representing probability
Imagine there is a button which you can press to display the numbers from one to six. Event A is selecting an odd number and Event B is selecting the number 2. These events are mutually exclusive because you cannot select both the number 2 and an odd number at the same time.
Try to answer these questions and press the button ‘Answer’ to check if you are correct.
How would we show these events on a Venn diagram or how could you describe this event?
Event A would be one circle and Event B would be a separate circle because the events are mutually exclusive.
What is Event A?
Rolling an odd number
What is Event B?
Rolling the number 2
Where will the numbers 4 and 6 go if they do not fit into Event A or Event B?
Because the numbers 4 and 6 are neither odd (and don’t meet the conditions for Event A) nor are they the number 2 (and don’t meet the conditions for Event B), they will go outside the two circles of the Venn Diagram. In circle A, there are the values, 1, 3, 5, and in circle B, there is the number 2.
Task 3: Calculating the probability of events
Similar to a tree diagram, we can use the Venn diagram to calculate the probability of Event A or B happening.
When the events are mutually exclusive:
The probability of Event A or Event B happening = the probability of A + the probability of B.
This is indicated as P(A or B) = P(A) + P(B).
Complete the formula using the data from the Venn diagram description from the previous task, and calculate the probability as a fraction of Event A or B happening.
P(A or B) = P(A) + P(B)
Click on ‘Answer’ to reveal the answer.
P(A or B) =
P(A or B) =
Therefore, the probability of getting an odd number (Event A) OR of getting a 2 is
When the events are non-mutually exclusive:
Let’s consider a second example where Event A is getting an even number and Event B is getting a number greater than 3. These events are non-mutually exclusive because the criteria for both is fulfilled if we get a 4 or a 6.
Where will we place the numbers from 1-6?
Complete the Venn diagram in the fillable document Venn Diagram Task 3 or complete it using a method of your choice.
Remember: Event A is getting an even number and Event B is getting a number greater than 3.
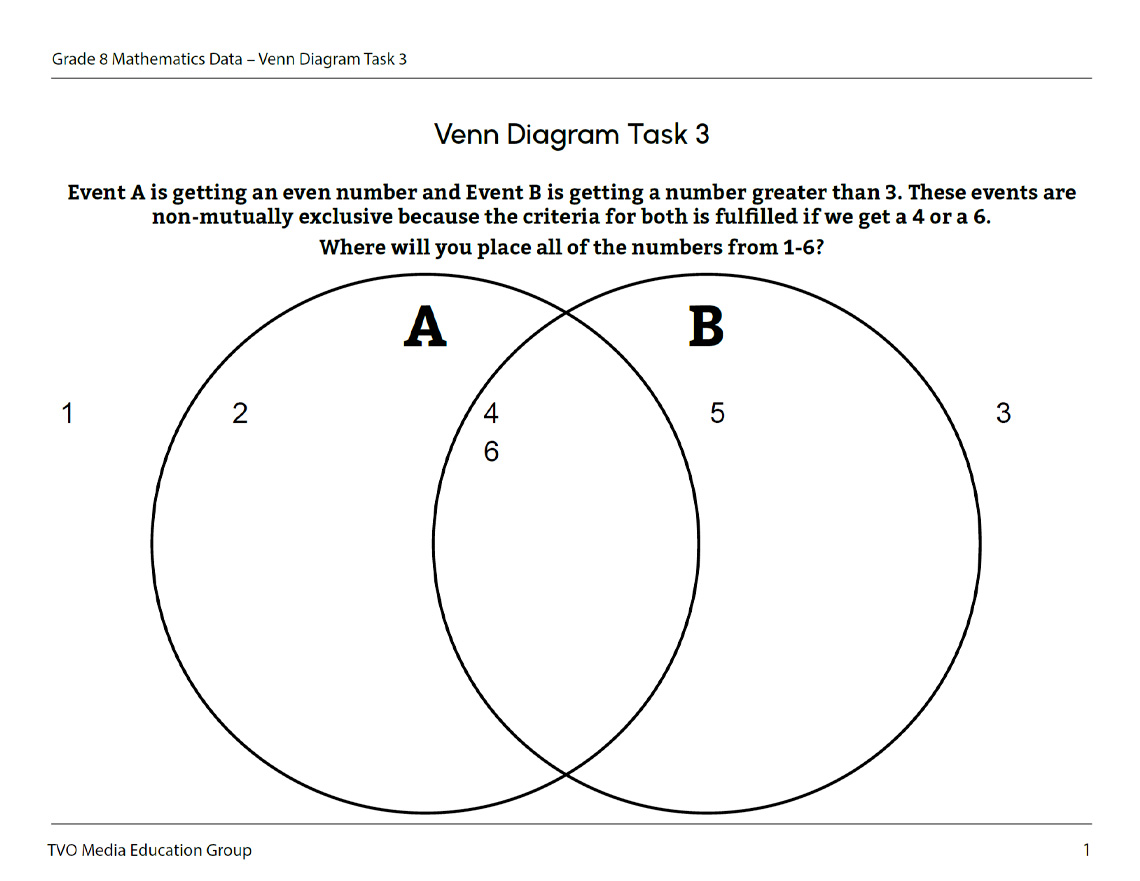
Press the button ‘Answer’ to check the answer and Venn diagram.
Numbers 4 and 6 are placed in the overlapping middle quadrant as they represent outcomes which satisfy both events.
The probability of A or B happening = the probability of A + the probability of B − the probability of A and B.
We can represent this as the formula:
P(A or B) = P(A) + P(B) − P(A and B).
Let’s try it!
Plug in the probabilities from each part of the data previously used to find out the probabilities of Event A or Event B.
Use your previous Venn Diagram to answer the following questions to help you calculate the probability of Event A or Event B, step by step.
Probability of Event A or P(A) means the probability of getting an even number. What numbers do we need to succeed and what is the probability?
Press ‘Answer’ to check if you are correct.
{2,4,6}, so the probability is
Probability of Event B or P(B) means the probability of getting a number greater than three. What numbers do we need to succeed and what is the probability?
Press ‘Answer’ to check if you are correct.
{4, 5, 6}, so the probability of this event is also
P(A and B) means the probability of getting an even number that is also greater than 3. What numbers do we need to succeed and what is the probability?
Press ‘Answer’ to check if you are correct.
{4, 6}, so the probability is
You can now calculate the probability of Event A or Event B using the formula:
P(A or B) = P(A) + P(B) − P(A and B)
Press ‘Answer’ to check if you are correct.
The probability of Event A or Event B is
Consolidation
Using a Venn diagram to determine Probability

Nine students in a class have a bicycle. four students have golf clubs, and three students have both a bicycle and golf clubs.
Create or describe a Venn diagram for this information. You may use TVO Mathify or use your notebook to create the Venn diagram and answer the questions.
Press the ‘TVO Mathify' button to access this interactive whiteboard and the ‘Activity’ button for your note-taking document. You will need a TVO Mathify login to access this resource.
TVO Mathify (Opens in new window) Activity (Open PDF in a new window)Last questions!
- How many students are represented in the Venn Diagram?
- If one student is selected at random, what is the probability that this student has only a bicycle?
- If one student is selected at random, what is the probability that this student has both a bicycle and golf clubs?
Reflection
As you read the following descriptions, select the one that best describes your current understanding of the learning in this activity. Press the corresponding button once you have made your choice.
I feel…
Now, expand on your ideas by recording your thoughts using a voice recorder, speech-to-text, or writing tool.
When you review your notes on this learning activity later, reflect on whether you would select a different description based on your further review of the material in this learning activity.
Connect with a TVO Mathify tutor
Think of TVO Mathify as your own personalized math coach, here to support your learning at home. Press ‘TVO Mathify’ to connect with an Ontario Certified Teacher math tutor of your choice. You will need a TVO Mathify login to access this resource.
TVO Mathify (Opens in new window)