Minds On
Representing information on a graph
Graphs can provide us with lots of information.
For example, if we want to track the weather in a city, we can use a grid to create a graph and examine how the temperature goes up and down.
The following is an example of a line graph displaying temperature changes over two years.

A line graph titled Temperature in a City. Horizontal x-axis is titled 'month,' and is labelled every 2 months from March 2019 to January 2021. The y-axis is titled 'Temperature' in degrees Celsius, and starts at 0 and goes up by fours. The line indicating temperature hovers near or below 10 degrees Celsius for much of 2019. In 2020, the temperature steadily increases from 10 degrees to a high of 20 degrees in August. The temperature starts to drop again as the months get closer to 2021.
Action
Cartesian plane
A Cartesian plane is a type of grid where you can identify points or coordinates and express how the location of the points change from one place to another.
To help us understand the Cartesian plane a little better, let’s explore how to use it.
Complete the Cartesian Plane using the following printable document. You can also use a method of your choice.
How to plot and label points on a Cartesian plane
A point is usually plotted as a dot. To plot a point, we always start at the place where the x and y axis meet in the bottom left corner. This point is called the origin.
From the origin, we always move right (horizontally) first.
Let’s move 4 blocks to the right of the origin.
Next, move up (vertically) 3 blocks. We call this point (4,3).
The 4 represents the horizontal distance, and the 3 represents the vertical distance moved from the origin. The 4 and 3 are called the coordinates of the point.
(4,3) is an example of an ordered pair. This means the order of the numbers is important.
Switching the numbers creates a different point. For example, (3,4) is a different point than (4,3) since (3,4) is 3 blocks to the right and 4 blocks up from the origin.
When you have tried plotting the points yourself, you may press ‘Answer’ to reveal a Cartesian plane with the plotted points.
Task 1: Percentage of daily sunshine
Here are two cities: City A and City B. There are two line graphs.

Line graph titled Daily Percent of Sunshine in City A. The x-axis is titled 'Months' from January through December. The y-axis is titled 'Sunshine Percent' and starts at 0% going up by twenties to 100%. The following data points; January is 30%, February is 40%, March, April, and May are just above 40%, June is 55%, July at 60%, August is below 60%, September and October are 50%, November is 30%, and December is less than 30%.

Line graph titled Daily Percent of Sunshine in City B. The x-axis is titled 'Months' from January through December. The y-axis is titled 'Sunshine Percent' and starts at 0% going up by twenties to 100%. The following data points; January and February are 80%, March is less than 80%, April at 70%, May is less than 80%, June and July at 80%, August is less than 80%, September, October, and November at 80%, and December is more than 70%.
Identify one point on the City A graph and one point on the City B graph in the same month.
You can choose January and July, or any other two months.
What is the difference between these two points (January and July) on both graphs?
Which months show the biggest difference in percentage of hours of sunshine a day between the two cities?
You might notice that both graphs resemble a Cartesian plane and use dots to signify certain points. Imagine that the months on the x-axis were replaced with the numbers 1 through 12, and the y-axis was labeled 0 through 5. On the City A graph, the point for February would be located at (1,2) on the plane. On the City B graph, October would be located at (10, 4).
Who might find this information useful? How would it be helpful to them?
For this activity, respond to the questions, and record your ideas in a notebook or a method of your choice.
Task 2: Raptors moving homes
Did you know that the Toronto Raptors didn’t always play their home games at the Scotiabank Arena?
It’s true! They actually used to play their home games at the Rogers Centre (originally Skydome) for a few years starting in 1995, followed by the Air Canada Centre in 1999, which was renamed Scotiabank Arena in 2017.

The following is a Cartesian plane that has a location of where the Raptors used to play and where they play now.
The x-axis is labelled with the numbers 1 through 8, and the y-axis is labelled 1 through 8. There is a point labelled Rogers Centre at the intersection of 2 and 4. There is a point labeled Scotiabank Arena at the intersection of 7 and 4.
Describe the location of the Rogers Centre and the Scotiabank Arena using points.
Use units (or blocks) to describe how the location of the stadium changed. An example of describing how a point has changed could be: Point X is now 3 units up and 4 over.
Record your ideas in a notebook or a method of your choice.

Consolidation
Task 1: What is the change?
There are two smiley face emojis on a Cartesian plane. One is labeled A, and the other is labeled B.
- What are the coordinates of each smiley face?
- How have the coordinates changed from point A to point B?

An 8 by 8 Cartesian plane labelled with vertical y-axis and horizontal x-axis. The bottom left corner of the grid (the origin) has coordinates of x = 0, y = 0. Smiley face A is located 2 units right and 6 units up from the origin. Smiley face B is located 7 units right and 3 units up from the origin.
Task 2: Plotting points and describing how they change
Plotting points on a Cartesian plane
Now, let’s practice plotting points on a Cartesian plane. On the following graph paper, or using a method of your choice, plot a small square at (2,2), a hexagon at (3,1), a triangle at (8,5), and a circle at (6,1).
Once you have plotted the points, you can check your answer by matching the shape with the correctly plotted Cartesian plane.
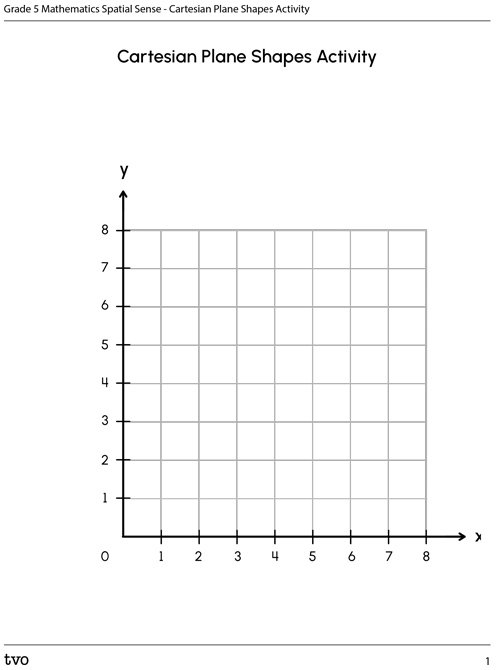
Press the Activity button to access the Cartesian Plane Shapes Activity.
Activity (Open PDF in a new tab)Describing points on a Cartesian plane
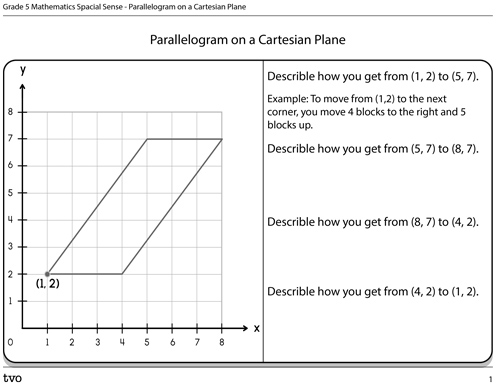
Now let’s practice describing points on a Cartesian plane. The following is a Cartesian plane with a parallelogram. You will write the coordinates beside each corner of the parallelogram. The first one is done for you.
After writing the coordinates, describe using the words “right or left” and then “up or down” for how to move from one corner of the parallelogram to the next.
Start with the point (1,2) and move clockwise (same direction clock hands move) around the parallelogram. The points are (1,2), (5,7), (7,8), and (4,2).
Complete the Parallelogram on a Cartesian Plane in your notebook or using the following fillable and printable document. You can also use another method of your choice.
After completing the activity, you may check your answers by matching the following descriptions of how you get from one point to another.
Press the Activity button to access the Parallelogram on a Cartesian Plane.
Activity (Open PDF in a new tab)Reflection
As you read through these descriptions, which sentence best describes how you are feeling about your understanding of this learning activity? Press the button that is beside this sentence.
I feel…
Now, record your ideas using a voice recorder, speech-to-text, or writing tool.
Connect with a TVO Mathify tutor
Think of TVO Mathify as your own personalized math coach, here to support your learning at home. Press ‘TVO Mathify’ to connect with an Ontario Certified Teacher math tutor of your choice. You will need a TVO Mathify login to access this resource.
TVO Mathify (Opens in a new tab)