Minds On
What are fluids?
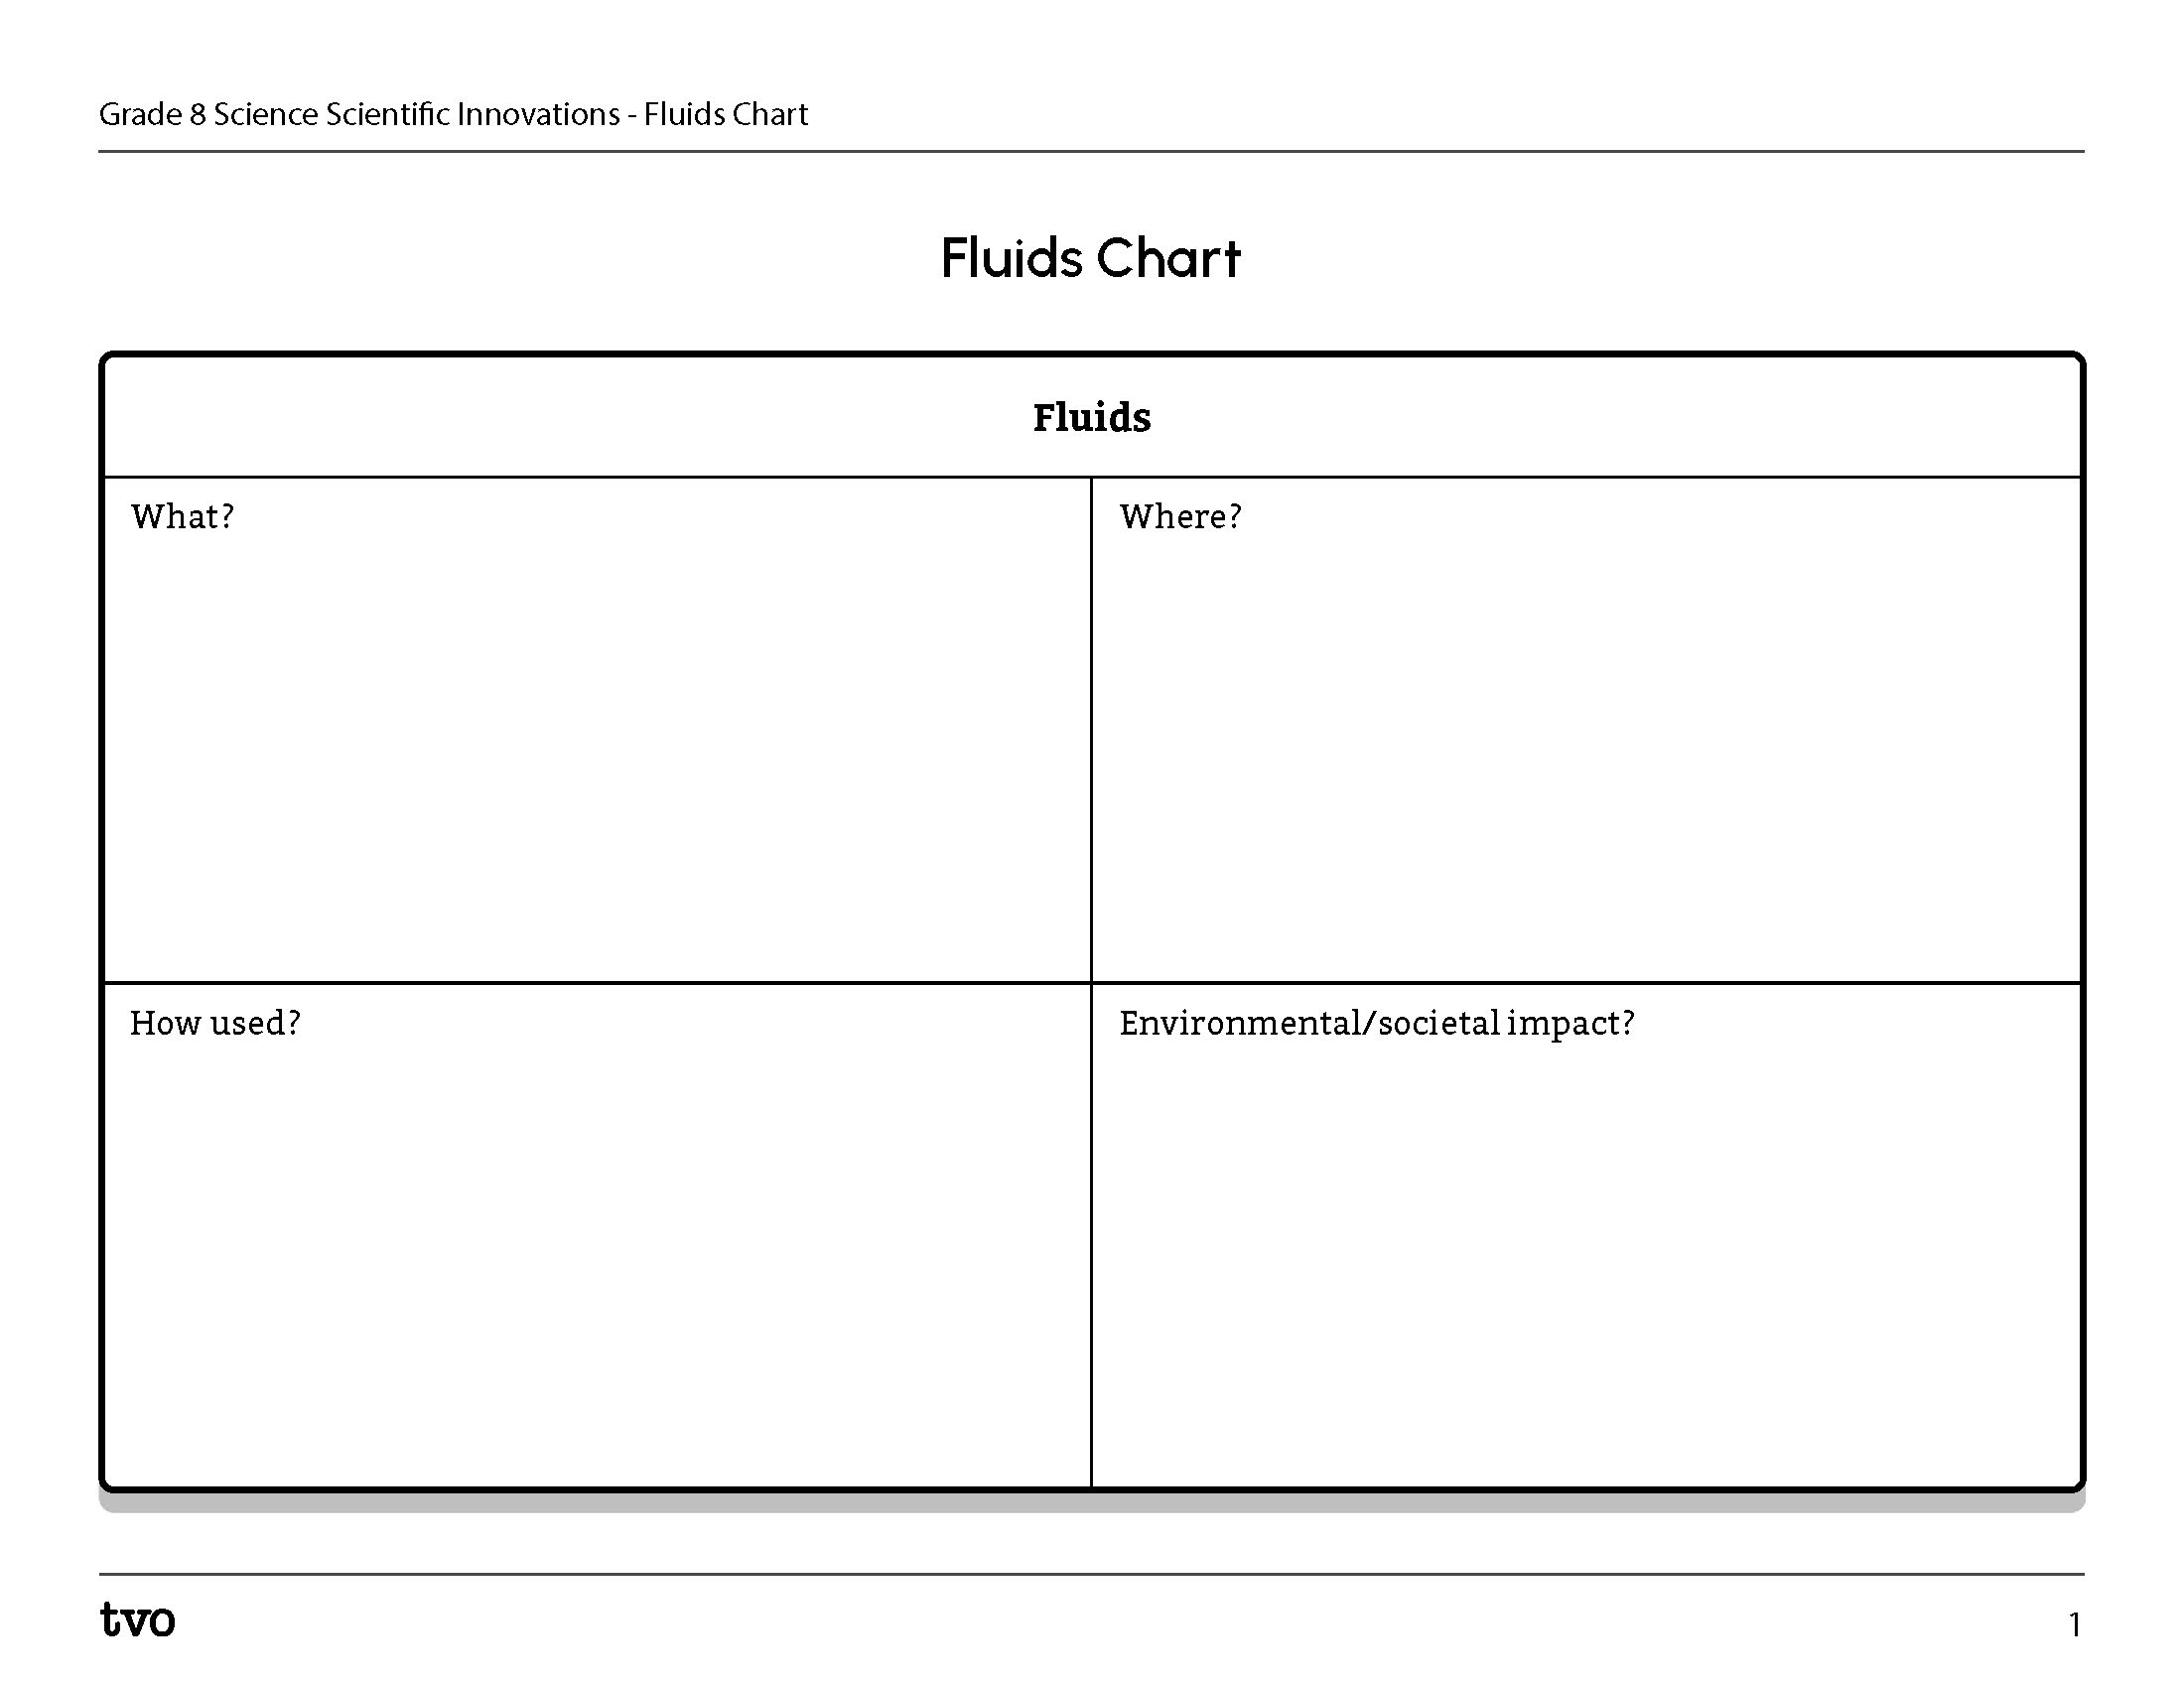
What do you know about fluids? Using the organizer below, or using another method of your choice, list all of the things you know about fluids under the following four headings.
- What? What do you think fluids are? Give as many examples as you can think of.
- Where? Where do you think fluids are found?
- How are fluids used? Describes ways in which you think humans and other living things use fluids and how we can use them to do work.
- Environmental and societal impact? Describe some of the ways you think fluids could be harmful to the Earth (including the ways we use them). Also, describe some of the benefits that fluids provide for society and the environment.
Complete the Fluids Chart in your notebook or using the following fillable and printable document. If you would like, you can use speech-to-text or audio recording tools to record your thoughts.
If possible, compare your responses with someone else’s answers. Underline, bold, or highlight the two most important points in each quadrant.
Pause and Reflect
The human body needs fluids
We need fluids to stay alive! What fluids can you think of that we need to stay alive? Generate a list of fluids and how the human body uses those fluids to stay alive. Brainstorm your ideas orally, digitally, in print, or in another method of your choice.
Press ‘Sample Answer’ to access ways the human body uses fluid to stay alive.
| Fluid | How the body uses it… |
|---|---|
| oxygen | releases energy from food |
| blood | acts as a transport system to take materials to cells as well as gather wastes from cells |
| sweat | cools the body |
| saliva | lubricates food for swallowing and begins chemical digestion |
| urine | eliminates dissolved waste from the body |
Action
Innovation in Canada
This learning activity features emerging technologies, STEM contributions, and Canadian innovations that are making a difference.

How fluids are used

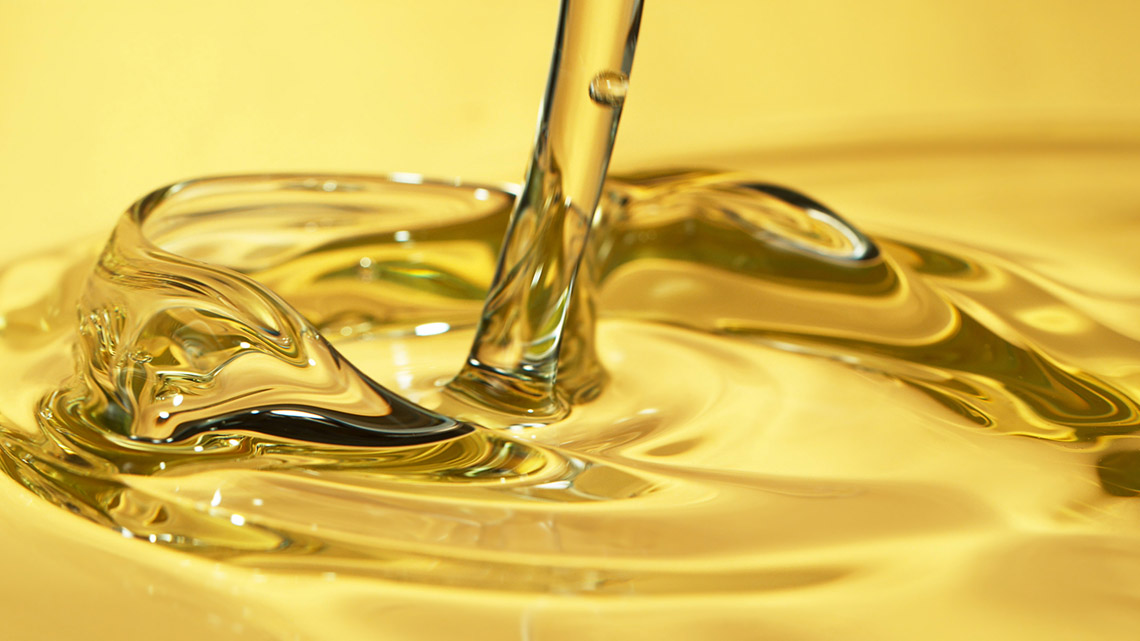
When you consider the word fluid, you likely think of water, as this is the most common fluid. We live in a world full of fluids, but not all fluids are liquids. Fluids are substances that have no fixed shape and are free to flow. This means gases are fluids too.
Fluids have certain characteristics that define them as fluids. For example, fluids do not have a definite shape of their own. Instead, both gases and liquids take the shape of their container.
Check out this video to see how a liquid can take the shape of its container.
Investigating flow
Fluids can flow because the particles of liquids and gases are free to move about. The ability to flow through, around, or over something is a key characteristic of fluids. Can you think of any real-world examples that involve fluids flowing? Brainstorm your ideas using a method of your choice.
Press ‘Sample Answer’ to access real-world examples that involve fluid flowing.
- Water flows through a river
- Air flow helps an airplane fly
- Oil and gas flow through pipes
Types of flow
There are two types of flow:
- laminar flow is smooth and regular
- turbulent flow is choppy and irregular

An image showing laminar flow and turbulent flow. Laminar flow is smooth and regular. This is represented by straight arrows. Turbulent flow is choppy and irregular. This is represented by wavy arrows that are crossing one another.
Rate of flow
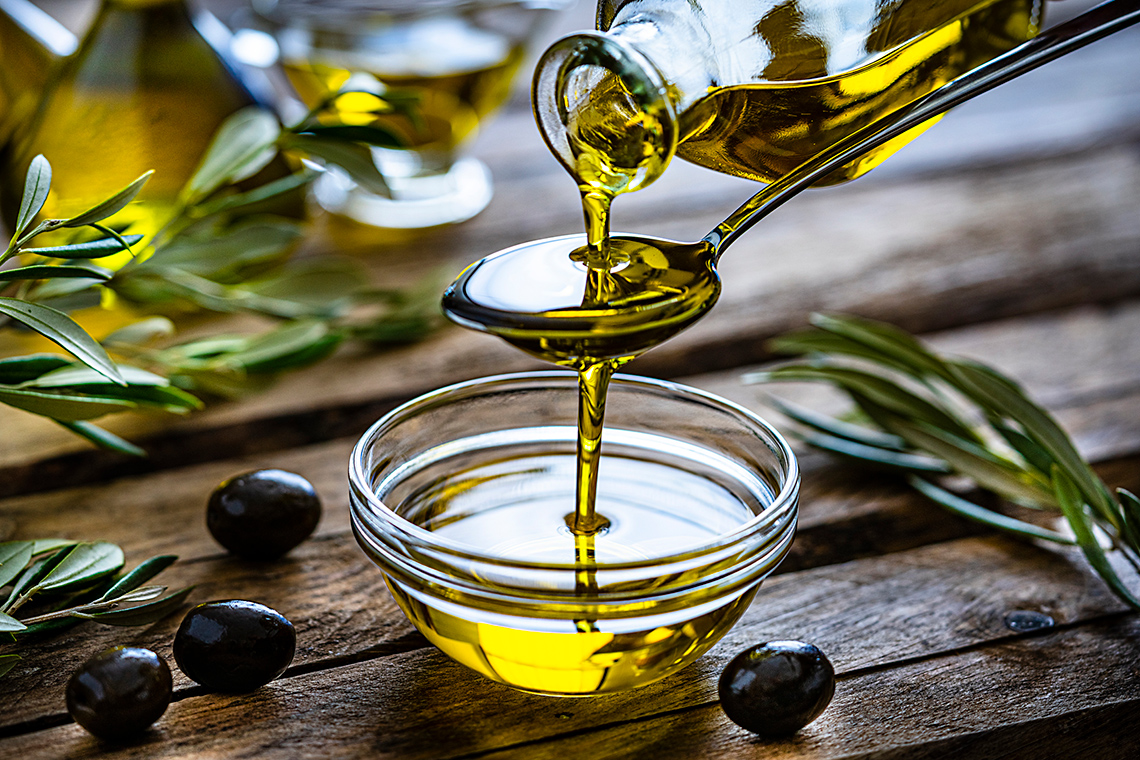
Not all fluids flow at the same rate. For example, if you poured out a glass of water and a glass of thick (“viscous”) honey at the same time, the water would flow faster than the honey.
Flow Rate measures the volume of fluid moving past a certain point in a given amount of time. For example, if it takes 4 seconds to fill up a 1 litre (L) container with water, the flow rate is 1 L/4 seconds or 0.25 L/s. Flow rate depends on many factors:
- the type of fluid (thin or thick)
- the force that is pushing the fluid
- the size of pipe or opening that the fluid is coming out of
- the type of surface the fluid is flowing over
- the temperature of the fluid
Test Your Skills!
Calculating flow rate
Flow rate measures how fast a fluid flows and is recorded using volume of fluid per unit time (for example mL/s or L/s).
For the following scenarios, can you calculate the flow rate? Record your responses in a notebook or using a method of your choice.
- It takes 5 seconds for 250 mL of syrup to flow through a funnel into a container. What is the flow rate of the syrup through the funnel?
- 5 L of water takes 2 minutes to flow through a hose. What is the flow rate of the water through the hose?
When you are ready, press ’Let’s Check!’ to review the calculations and check your responses.
- It takes 5 seconds for 250 mL of syrup to flow through a funnel into a container. What is the flow rate of the syrup through the funnel?
250 mL/5 seconds = 50 mL/s
The flow rate of the syrup through the funnel is 50 mL/s
- 5 L of water takes 2 minutes to flow through a hose. What is the flow rate of the water through the hose?
5 L/2 minutes = 2.5 L/m
The flow rate of the water through the hose is 2.5 L/m
Viscosity, cohesion, and adhesion
Viscosity is the measure of how easily a fluid’s particles are able to slide past one another. Think of viscosity as the thickness of a fluid, or its resistance to flow.
Viscosity is affected by these two factors:
- Cohesion is the measure of how strongly particles of a fluid attract each other. Particles with greater cohesion typically stick together and therefore flow more slowly, such as maple syrup.
- Adhesion is the attraction between the particles of one substance and the particles of another substance. For example, when you pour a liquid out of a container, sometimes particles adhere to the sides.
 Description
a dropper adding a drop of liquid to another drop of liquid that stick together. The word cohesion appears. A second dropper adding a drop of liquid to a leaf. The word adhesion appears.
Pause and Reflect
The flow of fluids
What factors can affect the flow of fluids? Use an example to help you explain.
Press ‘Factors’ to access the factors that can affect the flow of fluids.
The flow of fluids can be influenced by factors such as:
- viscosity (thickness)
- resistance to flow
- size of opening that liquid is flowing through
- force that is pushing the fluid
- temperature
- type of surface the fluid is travelling on/in.
Let’s experiment!
Explore this video to learn more about the steps of the Scientific Experimentation Process.
For the next component of this learning activity, you have two options. You may wish to complete both or only one. Explore both options before you decide which one to complete.
Safety
Before you explore the following experiment, let’s perform a safety check.
Option 1: Comparing flow rate

The purpose of this experiment is to explore the differences in flow rates for a variety of substances.
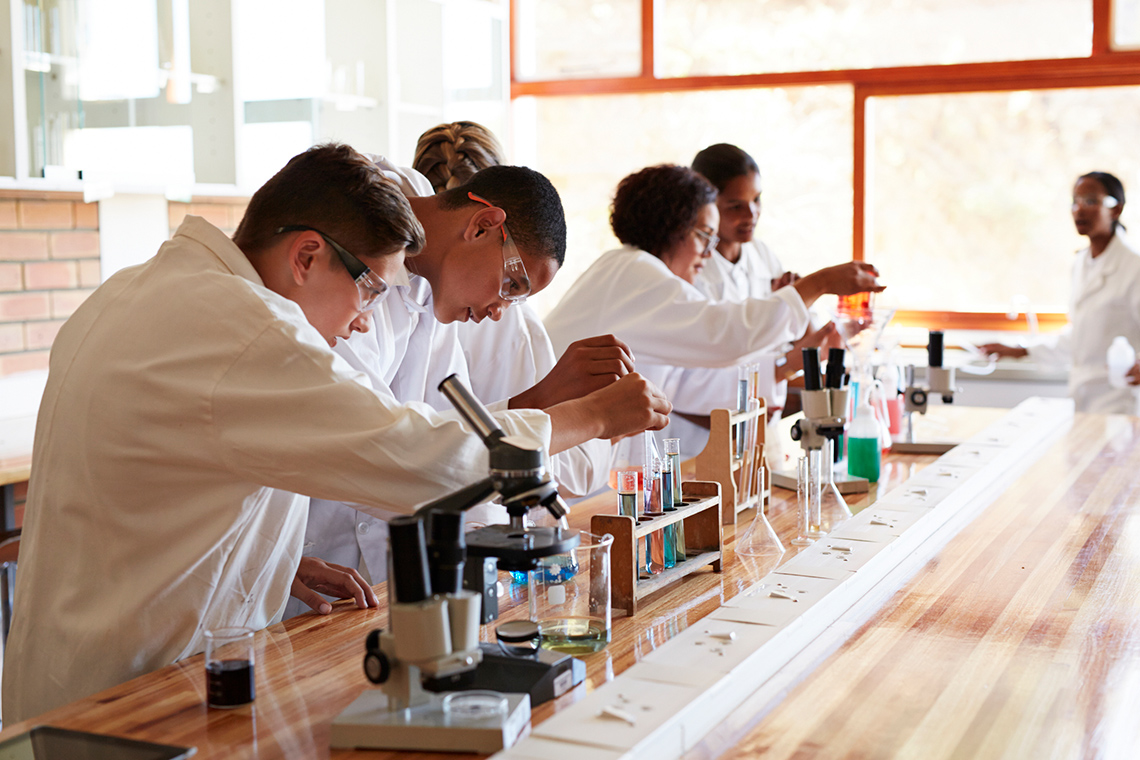
Hands-on Science
Comparing flow rate
For this experiment, we will be learning about the flow rates of different fluids.
Complete the Lab Sheet: Comparing Flow Rate in your notebook or using the following fillable and printable document. If you like, you may use speech-to-text or audio tools to record your thoughts.
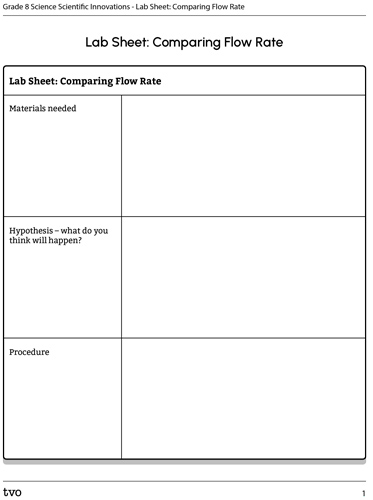
Press the Activity button to access the Lab Sheet: Comparing Flow Rate.
Activity (Open PDF in a new tab)Press the following tabs to access the materials needed and experimental procedure for the Comparing Flow Rate experiment.
- graduated cylinder (or measuring cup)
- clear plastic cups
- marker
- two funnels
- timing device
- ruler
- cookie sheet or board
- something to prop up the cookie sheet or board (a stack of books work well!)
- water
- variety of fluids: ketchup, shampoo, cooking oil, syrup, molasses (or substances with similar thickness)
- variety of surfaces: wax paper, plastic wrap, aluminum foil, sandpaper
Part A: Flow rate
- Create your control cup by measuring out 35 mL of water and pouring it into one of the plastic cups. Use the marker (or a piece of tape) to indicate the top of the water level. Empty the water from the cup.
- Set up your equipment so that the funnel is positioned over the control cup you just created, at a distance that will remain constant throughout the experiment.
- Measure out 45 mL of water.
- With your finger covering the opening at the bottom of the funnel, pour the water into the funnel.
- When you’re ready, start the timer and remove your finger from the funnel. Stop the timer once the water has reached the 35 mL line that you marked in step 1.
- Record your observations in the chart provided.
- Wash and dry the funnel and repeat these steps using with the other liquids. Don’t forget to complete your observation chart after each fluid.
Part B: How surfaces affect flow rate
- Create your own experiment to investigate how the type of surface (cooking tray, plastic wrap, wax paper, foil or sandpaper) will affect the flow rate on a downward slope.
- Record the step-by-step procedure you will use and any safety precautions to consider.
- Create a table to record observations. Include the following sections in your table: materials needed, hypothesis, procedure, observations, conclusions, questions.
- If possible, share your experiment with someone for feedback.
- Conduct your experiment and record your findings.
Option 2: Viscosity and flow rate

The purpose of this experiment is to explore the differences in flow rates for a variety of substances.
Hands-on Science
Viscosity and flow rate
For this experiment, we will be learning about how the viscosity of fluids impacts flow rate.
Complete the Lab Sheet: Viscosity and Flow Rate in your notebook or using the following fillable and printable document. If you like, you may use speech-to-text or audio tools to record your thoughts.
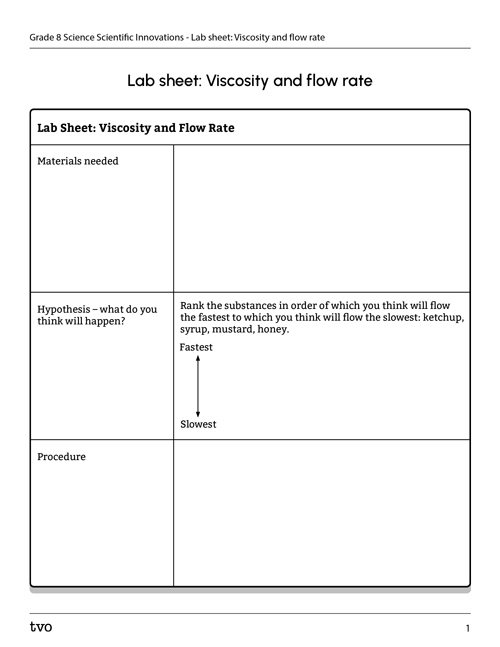
Press the Activity button to access the Lab sheet: Viscosity and flow rate.
Activity (Open PDF in a new tab)Press the following tabs to access the materials needed and procedure for the Viscosity and Flow Rate experiment.
If you do not have access to materials, access the “Video demonstration” tab to explore the experiment in action. You can use the video to make your observations and draw your conclusions.
- 1/2 tbsp table syrup
- 1/2 tbsp ketchup
- 1/2 tbsp mustard
- 1/2 tbsp honey
- 1 timer (optional)
- 1 plate — large, white (not paper)
- 1 spoon
1. Put each liquid on the plate. Be careful to keep them apart.
If you wish, you can use a timer to time how fast your liquids move down the plate. If you use a timer, it is recommended that another person help you with this portion of the experiment.
2. Slowly tip the plate until one of the liquids starts to move.
3. Tap the plate with your spoon rapidly. Does anything change?
4. Write down your observations.
Check out this video to explore a demonstration of the Flow Rate and Viscosity experiment. Please note that materials and procedure in the video may vary slightly from what is listed in the previous tabs.
Regulating flow rate
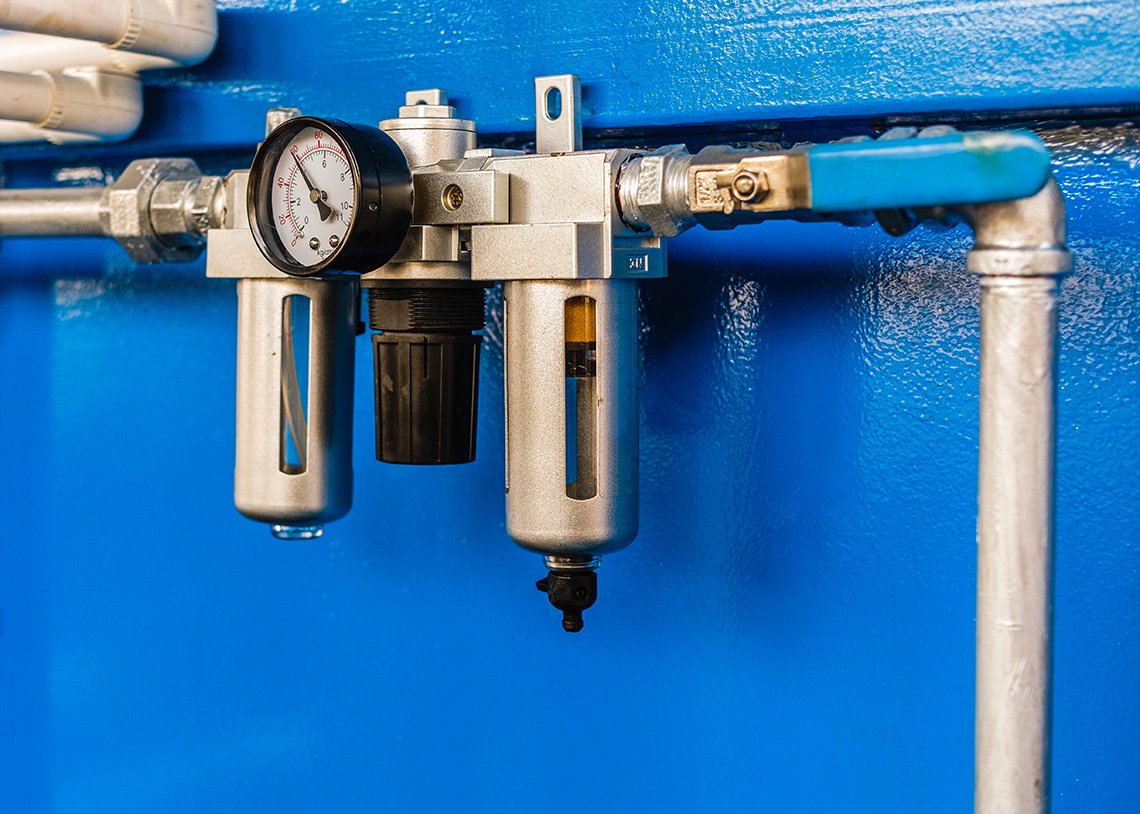
Fluid mechanics is the study of how fluids behave, and fluid dynamics is the study of fluids in motion. This is broken into aerodynamics, which is the study of moving gases, and hydrodynamics, which is the study of moving liquids.
When do we use these concepts in the real world? Let’s learn more!
Press the following tabs to access uses of these concepts in the real world.
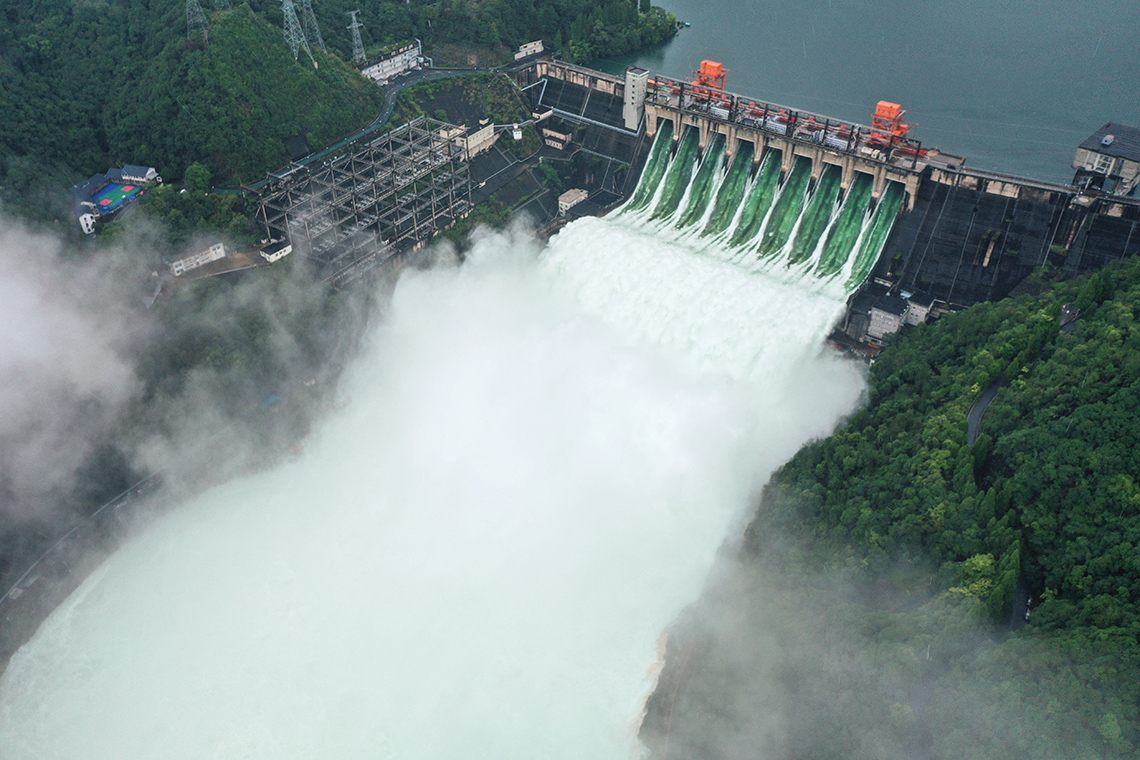
Dams are used to control the flow of water. During heavy rainfall, dams hold the water and then release it during lower periods of precipitation. Innovative technologies have allowed dams to also produce sustainable energy using turbines and generators. These are controlled by water flow.
Controlling the flow of fluids is important during the processing of many foods. For example, when making foods like margarine or shortening, hydrogen gas that is added to the food must be controlled so it doesn’t mix too quickly or too slowly. Many mixing processes require fluid control so that food doesn’t spoil.
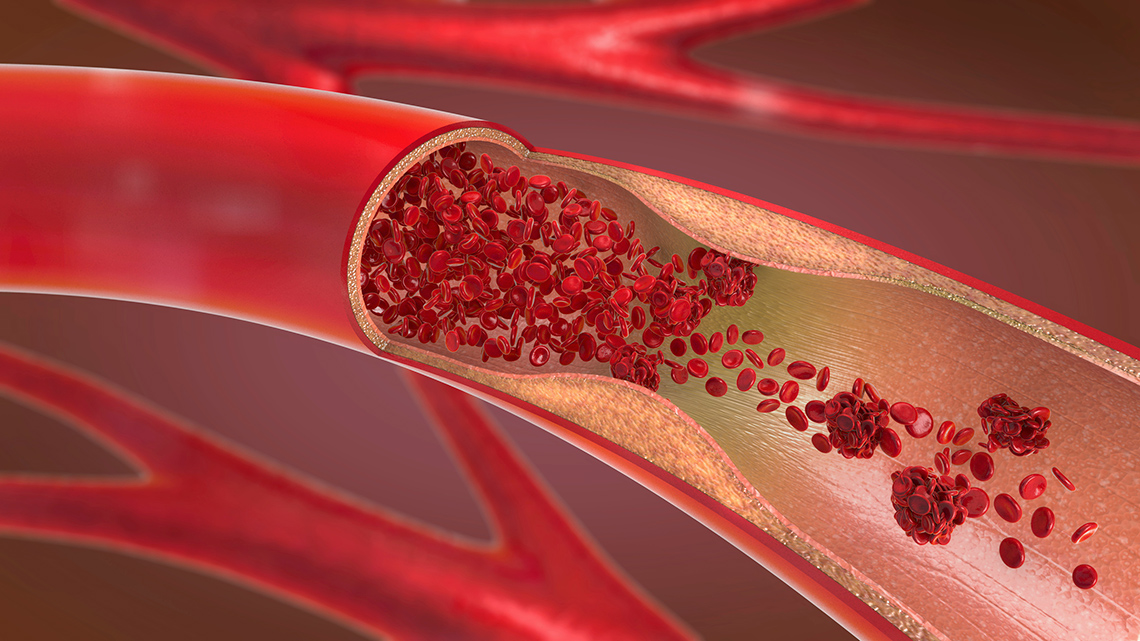
Blood flow is an important fluid movement within your body. There are various factors that determine the rate of blood flow in your body. For example, blood thinners are a medication that some people take to keep blood flowing and avoid blood clots. In contrast, some people take a medication to promote blood clotting if they have a condition called hemophilia, meaning they will bleed excessively if injured.
Central to blood flow, the heart’s ability to function properly impacts the rate of blood flow in the body, ensuring survival of the organs and tissues depending on this vital fluid. When the heart, veins, or arteries do not function at peak efficiency, organs and tissues may suffer. Artificial hearts are an innovation that has saved lives by continuously and efficiently pumping blood through the body.
Check your understanding!
For each sentence, select the missing word from the drop-down menu.
Consolidation
Matching!

In this learning activity, you were introduced to many new scientific terms about fluids.
For each term, select the corresponding definition.
Now, match some more terms to their definitions.
Synthesize!

Presenting… ketchup!
You were just hired by a ketchup company to make a presentation to a group of students about the difference between viscosity and flow rate. Your presentation can be delivered using a method of your choice, and needs to include the following:
- the difference between flow rate and viscosity
- how to calculate flow rate and viscosity
- descriptions of the factors that affect flow rate and viscosity
- why, as an employee of a ketchup company, you are concerned with viscosity
Use the following checklist as a guide.
When planning your presentation, consider:
Reflection
As you read the following descriptions, select the one that best describes your current understanding of the learning in this activity. Press the corresponding button once you have made your choice.
I feel…
Now, expand on your ideas by recording your thoughts using a voice recorder, speech-to-text, or writing tool.
When you review your notes on this learning activity later, reflect on whether you would select a different description based on your further review of the material in this learning activity.