Minds On
Energy in everyday life

Homes, businesses, industrial spaces, and institutions, like schools and hospitals, all use energy on a daily basis.
What kinds of energy do you think are used by these locations every day?
Let’s explore the following images for a few examples.

Home office
A home office with a light switch on the wall and various items plugged into an electrical outlet are examples of electrical energy use.

Stove
A electric stove with a light on above it in the rangehood are examples of electrical energy use.

Running water
Energy use in the form of running water for a doctor preparing for a medical procedure.

Thermostat
A thermostat connected to a furnace, which allows heat control in buildings and homes. This is an example of electrical energy and often natural gas.
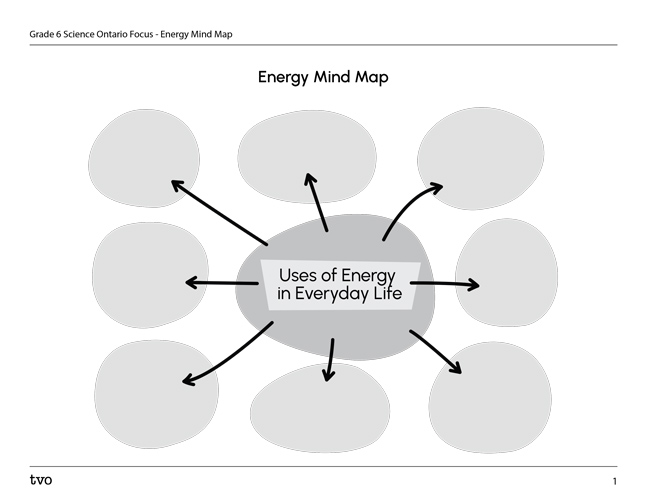
Brainstorm
Brainstorm
After exploring the previous images, can you think of any other uses of energy in our everyday lives?
Complete the “Energy Mind Map” in your notebook or using the following fillable and printable document. If you would like, you can use speech-to-text or audio recording tools to record your thoughts.
Action
Ontario connection
This learning activity highlights people, places, or innovations that relate directly to the province of Ontario. Enjoy the exploration!

The blackout of 2003
On August 14, 2003, there was a blackout that affected many cities in Canada and the United States. A blackout is when the electricity goes out in an area due to repairs or damage to the power grid.
Millions of people in Ontario, New York, and Ohio were affected by this blackout.
Access the following video to learn more about the blackout of 2003.
While exploring the video, try to notice the different perspectives, and record any questions that you might have using a method of your choice. What caused the blackout?
After learning more about the 2003 blackout, press the following tabs to access a few activity options. Be sure to choose of the following options to share your learning.
Prepare interview questions that you could ask a person who may have experienced this blackout.
What questions could you ask them?
Record your questions in a notebook or another method of your choice.
Write an article, a comic, or create a video about the 2003 blackout and what a person might have experienced.
Record your ideas and thoughts in a notebook or another method of your choice.
Self-assessment
Before submitting your work, review the following self-assessment checklist:
Did I explain my learning by…?
Monitoring Ontario’s grid
In Ontario, the Independent Electricity System Operator (or IESO for short) is at the center of our power grid. It manages and distributes the power made in Ontario’s different power plants.
Your teacher will provide you with the link to the IESO’s website, or you may use the following image to guide your investigation.
Click the image to enlarge in a new window.
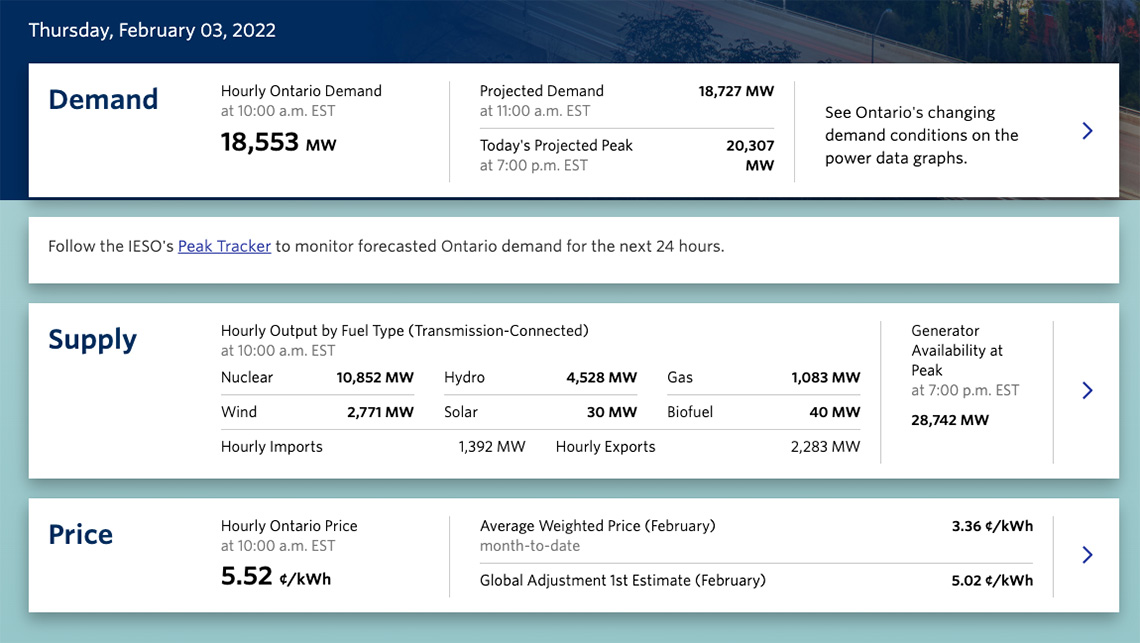
This chart is for Monday, January 31, 2022. It shows the hourly Ontario demand is 17,828 MW. The projected demand was 18,348 MW and the projected peak for the day was 20,468 MW. The hourly output by fuel type is listed as nuclear = 10,842 MW, wind = 208 MW, hydro = 3,884 MW, solar = 242 MW, gas = 3,787 MW and biofuel = 59MW. The hourly Ontario price is 4.69cents/kWh. In January the average weighted price was 4.42 cents/kWh and the global adjustment first estimate for January is 4.83 cents/kWh.
What data does the IESO share publicly?
Complete the “Observe, Infer, & Wonder: Electricity In Ontario Activity” in your notebook or using the following fillable and printable document. If you would like, you can use speech-to-text or audio recording tools to record your thoughts.
|
Observe What information do you notice on the website? |
Infer What do you know about this topic already? |
Wonder What do you want to know more about? |
|---|---|---|
|
|
|
|
Press the ‘Activity’ button to access Observe, Infer, & Wonder: Electricity In Ontario Activity.
Learning check!
Check out the following questions:
- What does MW stand for?
- How can you convert a kilowatt into a megawatt and vice versa?
- What is a kilowatt hour (kWh)?
Record your ideas and responses in a notebook or another method of your choice.
When you’re ready, press ‘Let’s Check!’ to access the correct answers.
- A megawatt is the standard unit of measure for bulk electricity. For example, the output of power for an electricity plant or that an entire city uses. To put this into perspective, one megawatt of electricity can power 400 to 900 homes for one year. It would take ten car engines to produce one megawatt.
- 1 megawatt = 1000 kilowatts or 1,000,000 watts
- A kilowatt hour is a unit of energy equal to one kilowatt of power sustained for one hour.
Self-assessment
Reflecting on our work and self-assessing is an important step in our learning process.
Before continuing, take a moment and use the following checklist to assess your learning thus far.
Did I…?
Student Success
Think!
List at least two items that you might find in a home or school that use electrical energy.
Then, try to describe what form of energy the electrical energy is being converted to.
Record your list in a notebook or another method of your choice.
If possible, share your list of items with a partner.
Press ‘Hint’ to access common types of energy.
Common types of energy:
- Electrical energy is energy produced by the movement of electrons.
- Heat (thermal) energy is a form of energy associated with the motion of atoms of molecules. The amount of heat energy increases as these particles move faster.
- Light energy is radiative energy that can be detected by the human eye and makes things visible.
- Sound energy is produced by vibrating matter and transmitted by waves through air and other medias.
- Mechanical energy is the energy of motion and/or potential to create motion
Note to teachers: See your teacher guide for collaboration tools, ideas and suggestions.

Investigate
Investigate
How much energy does an average school use? Let’s investigate!
Let’s start by examining a whole school board’s data.
Check out the following steps to guide our investigation.
1. Check out the average amounts of energy used by an Ontario elementary school board. This data represents totals for approximately 150 elementary schools within this school board.
An elementary school board’s average total:
- natural gas use = 10.2 M3/SqM
- electricity use = 61.0 KWH/SqM
- water use = 0.42 M3/SqM
- total energy use = 167.9 eKWH/SqM
2. Examine the following graph of the electricity used by one Ontario elementary school over three different years.

This is a graph that shows the electricity consumption for an Ontario elementary School over three years: 2019, 2020, and 2021. The graph is measured in kWh x 1,000,000. Here is the approximate data for the three years: 2019–September–no data, October–no data, November–6.2 kWh December–6 kWh January–7 kWh February–6.2 kWh March–6.5 kWh April–6 kWh May–6 kWh June–6 kWh July–5 kWh August–5 kWh Here is the data for 2020: September–6 kWh October–6 kWh November–6 kWh December–6 kWh January–6.2 kWh February–6 kWh March–5.5 kWh April–4 kWh May–3.8 kWh June–4 kWh July–4 kWh August–4 kWh Here is the data for 2021: September–5.5 kWh October–5.5 kWh November–5.8 kWh December–5.5 kWh January–5.8 kWh February–6 kWh March–5.5 kWh April–4.2 kWh May–4 kWh June–4.2 kWh July–4 kWh August–1 kWh.
Let’s analyze the data!
Refer to the graph we previously explored to guide your thinking, as we analyze the data.
Choose at least three of the following questions to respond to, or if possible, discuss with your teacher about which questions to respond to:
- Thinking about events that affected schools in 2020 and 2021, why might the energy use during these two years be lower than in 2019?
- How could you calculate the overall average energy use by this school over these three years?
- Make an estimate and justify your answer with your calculations. You will have to estimate as you explore the scale. Try to provide numbers to the nearest tenth (i.e., September 2021 is approximately 5.5 KWH).
Press ‘Hint’ to explore how to calculate an average.
- First, use the graph to estimate the value of electricity used in each month of a given year. Check out the estimates for 2021:
| Sept | Oct | Nov | Dec | Jan | Feb | Mar | Apr | May | June | July | Aug |
|---|---|---|---|---|---|---|---|---|---|---|---|
| 5.5 | 5.4 | 5.8 | 5.4 | 5.5 | 6.0 | 4.8 | 4.4 | 4.2 | 4.4 | 4.0 | 1.0 |
- Second, add up the totals for each month.
So, 5.5 + 5.4 + 5.8 + 5.4 + 5.5 + 6.0 + 4.8 + 4.4 + 4.2 + 4.4 + 4.0 + 1.0 = 67.6
- Next, divide the total by the number of months.
So, 67.6 ÷ 12 = an average of 5.63 kwH for this year.
- Compare this school’s monthly electrical use to the school board’s. How are they doing? What questions do you have?
- What other conclusions can you make based on this data? What patterns do you see? What reasonable explanations can you make about your observations or calculations?
- Record a summary for what you notice about the data.
Record your responses in a notebook or another method of your choice.
Self-assessment
You may use the following checklist to help you review your work.
Did I…?
Consolidation
Time to act!

Imagine that you are a member, or even the leader, of the Eco-team at a school.
What are a few actions that the school’s staff and students can take that would make an impact on energy use?
How might you advocate for thinking about using electricity responsibly? What are a few initiatives?
Consider the following examples:
- observe Earth hour in March
- lights off lunches
- unplug charged items
- turn off lights in unused spaces
- open blinds when possible, instead of using the lights
- wear a sweater instead of turning up the heat
- ensure doors to outside are closed in cooler weather
Your initiative
Check out the following task options and create a plan for your school/class as an initiative to help reduce the energy consumption.
If possible, share your plan with a teacher or a trusted adult.
Press the following tabs to access the various task options.

Make an announcement detailing your initiative. This could be in the form of an audio recording, a video, or a dialogue/script.
Record your ideas in a notebook or another method of your choice.

Create a calendar of energy-reducing events for a whole school year.
How will you display your plan?
Record your ideas in a notebook or another method of your choice.

What types of posters could you put up in classrooms or other locations in the school to make an impact?
What slogans can you come up with that will captivate your audience?
Design a few posters to demonstrate your initiative!
Record your ideas in a notebook or another method of your choice.
Reflection
As you read through these descriptions, which sentence best describes how you are feeling about your understanding of this learning activity? Press the button that is beside this sentence.
I feel…
Now, record your ideas using a voice recorder, speech-to-text, or writing tool.
Press ‘Discover More’ to extend your skills.
Discover MoreMeasuring your impact
- How could you measure the impact of your initiative?
- How would you use past data to compare it to future data?
- What different types of data could you collect and use?
Record your ideas in a notebook or another method of your choice.