Minds On
Ontario connection
This learning activity highlights people, places, or innovations that relate directly to the province of Ontario. Enjoy the exploration!

The Great Lakes

Map of the Great Lakes
Why are the Great Lakes important?
- What do you know about the Great Lakes?
- What do you wonder about them?
Explore the following activity about the Great Lakes and climate change, and complete only the outlined sections for now (what I think I know, and what I wonder).
Press ‘Hint’ to explore additional details for each question.
What I think I know: Record all your ideas about what you already know about the Great Lakes and climate change, even if you’re not sure if they are accurate.
What I wonder: What are you curious to learn more about when it comes to the Great Lakes and climate change?
What was confirmed: Refer to the first section of your chart and record ideas that were confirmed (accurate/ true) about what you already knew about the Great Lakes and climate change.
Misconceptions: Record any information that you thought was true at the beginning, but learned was incorrect or not quite as you had thought.
New learning: Record new information that you learned, and hopefully answer any of your wonderings.
Complete the Great Lakes and Climate Change Activity in your notebook or using the following fillable and printable document. If you would like, you can use speech-to-text or audio recording tools to record your thoughts.
|
What I think I know |
|
|
What I wonder |
|
|
What is confirmed |
|
|
Misconceptions |
|
|
New learning |
Press the ‘Activity’ button to access Great Lakes and Climate Change Activity.
Throughout this learning activity, you will return to the Great Lakes and Climate Change Activity chart to record new information.
Action
Lake Erie
Click the image to enlarge in a new window.

Lake Erie is one of the five Great Lakes and forms a boundary between Ontario (Canada) and Michigan (United States). It is the smallest of the Great Lakes by volume and the shallowest.
In this section of the learning activity, we will explore food chains found within Lake Erie and how climate change is affecting these food chains and the lake.
Food chains
What is a food chain?
Check out the following Science North video to learn more about food chains.
For each term, select the corresponding definition.
What do you think?
What would happen if you removed just one organism from an ecosystem? Use a specific example.
Record your ideas in a notebook or another method of your choice.
Press ‘Let’s Check!’ to access a possible response.
The ecosystem becomes unbalanced if an organism is removed.
For example, if you removed the killer whale from an ecosystem, then the penguin population might overpopulate, making it difficult for them to obtain food. They might then become competitive with other consumers for food.
Investigate
Investigate
Let’s investigate the following food web, which is specific to Lake Erie.
Them, record at least three observations in a notebook or another method of your choice.
Click the image to enlarge in a new window.
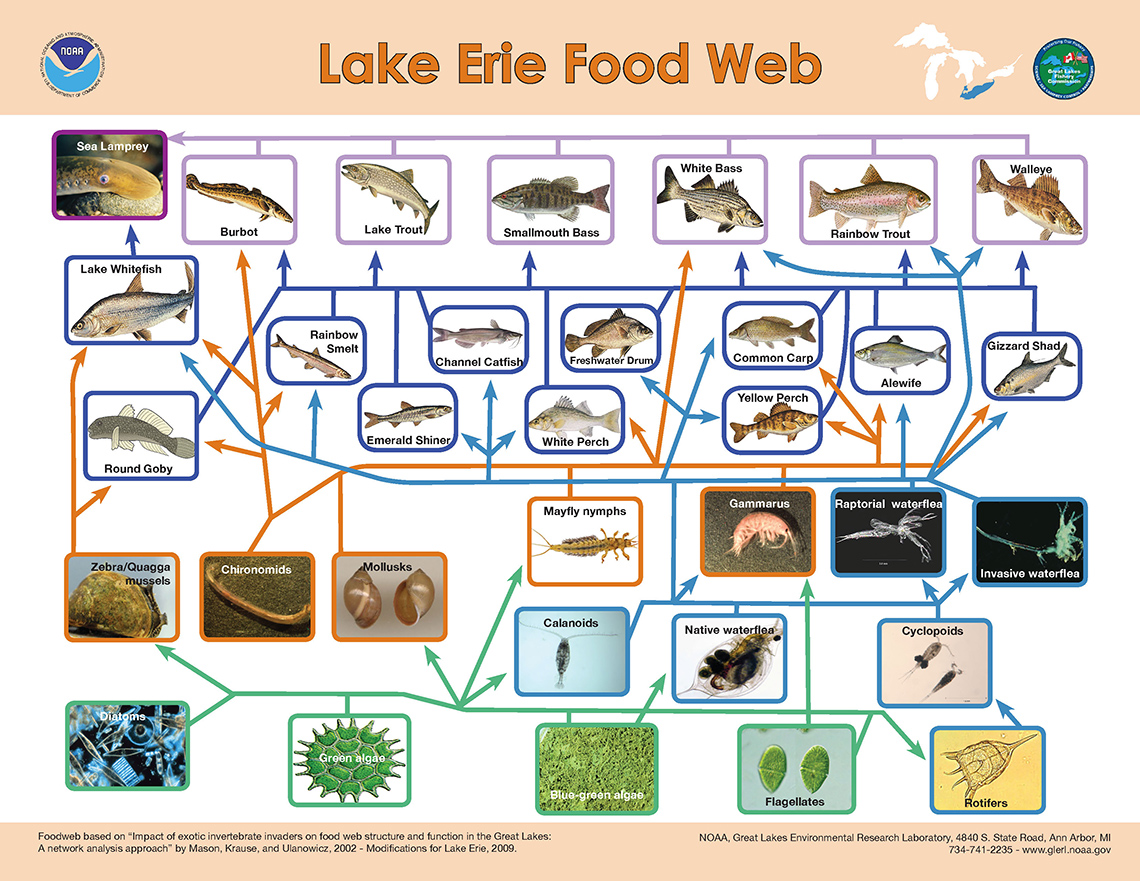
Lake Erie food web with various dominant species of fish, bacteria, plants, nymphs, etc. In order: Sea lamprey, piscivores (fish eaters), forage fish, macroinvertebrates, zooplankton (microscopic animals found in the water column), and phytoplankton (algae found in the water column). Producers are phytoplankton, primary consumers are the zooplankton, followed by the macroinvertebrates. Secondary consumers are the forage fish and piscivores, followed by the sea lamprey.
In a food chain, energy is transferred from producers to consumers. The energy is used by organisms to carry out complex tasks. Generally, energy originates from the sun and then is transformed into chemical energy through photosynthesis in primary producers, such as plants.
Smaller organisms then eat the plants and the energy flows from one organism to another.
In a marine ecosystem, such as Lake Erie, the primary producer is phytoplankton that produces nutrients and energy needed for the rest of the food chain. Not all of the energy generated or consumed at one level of the food chain gets passed on to the next level.
The effects of climate change
Begin by exploring the following graphs specific to Lake Erie.
The first graph examines the water level changes in Lake Erie as compared to Lakes Michigan and Huron. The second graph examines water temperatures of the lakes through a series of years.
Measurement systems
In Canada, we use the Metric system to measure length (e.g., millimetre, centimetre, metre), mass (e.g., milligram, gram), capacity (e.g., millilitre, centilitre, litre) and temperature (Celsius).
There are a few countries, including the United States that use the Imperial system to measure length (e.g., inch, foot, mile) mass (e.g., ounce, pound) and capacity (e.g., pint, gallon) and temperature (Fahrenheit).
We can convert between the Metric system and the Imperial system by using a conversion rate.
|
Example of a length conversion: |
Example of a temperature conversion: |
|---|---|
|
1 foot = approximately 30.5 centimetres or 1 foot = approximately 0.3 metres |
0 degrees Celsius = 32 Fahrenheit |
Press the following tabs to access the graphs.
What do you notice about the following graphs?
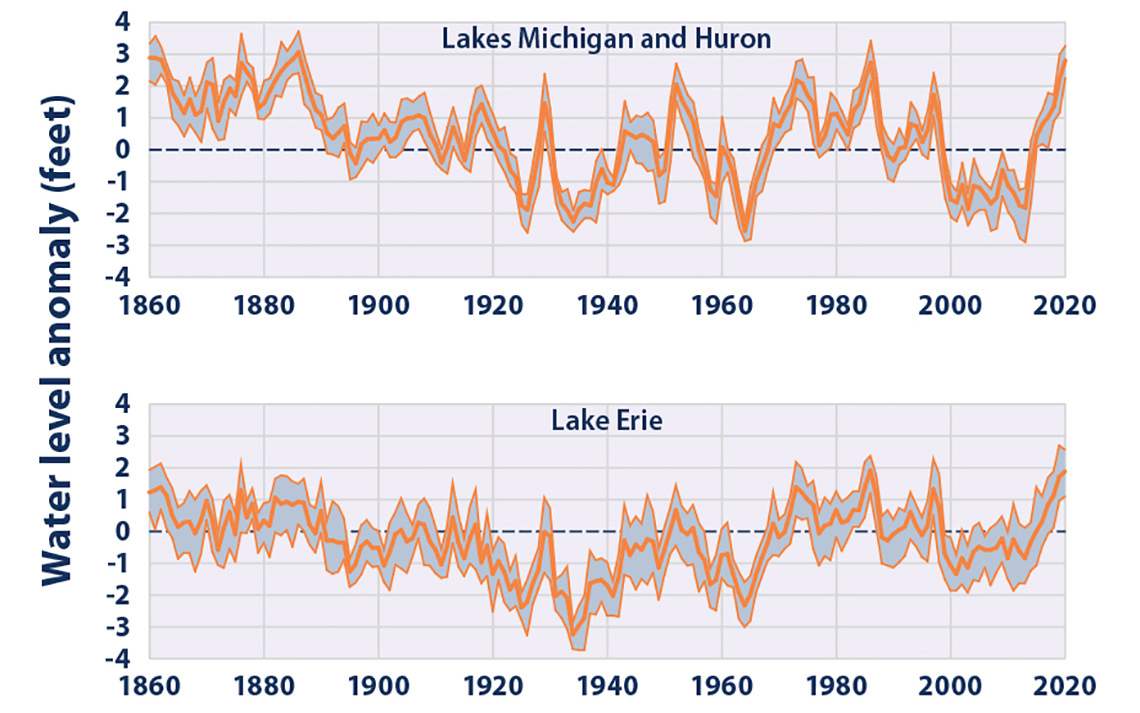
In this image there are two graphs. Along the y-axis (left side) it is labelled “Water level anomaly (feet)” and it begins are –4 increases by 1 until 4. Along the bottom of each graph are the years 1860 to 2020, increasing in 20-year intervals. There is a dotted line across the graph at 0 along the y-axis. The first graph is “Lakes Michigan and Huron” - From the year 1860 to 1900 the lines on the graph are above the 0 mark. Between 1900 and 1920 they occasionally start to dip below 0, but not always. Just after 1920 the line dropped way below zero to –3 and then back up to positive 3 and then back down again in 1940. The graph shows dramatic lines up and down and really plummets to –4 in 1960. It is back above 0 again from 1970 to 2000 and then drops again and remains below 0 until 2020.
The second graph is titled “Lake Erie”. The lines are a lot closer together and run along 0 (slightly below and slightly under) from 1860 to 1920. Between 1920 and 1950 the graph remains below 0, going back above 0 in 1950. In 1960 the lines drop below 0 again, and then they hover around 0 until 2020.
Let’s reflect
- Why do you think the water levels might change by a different amount of degrees in different years?
- Are these changes getting larger or smaller through the years? Why might that be?
Record your ideas in a notebook or another method of your choice.
What do you notice about the following graphs?
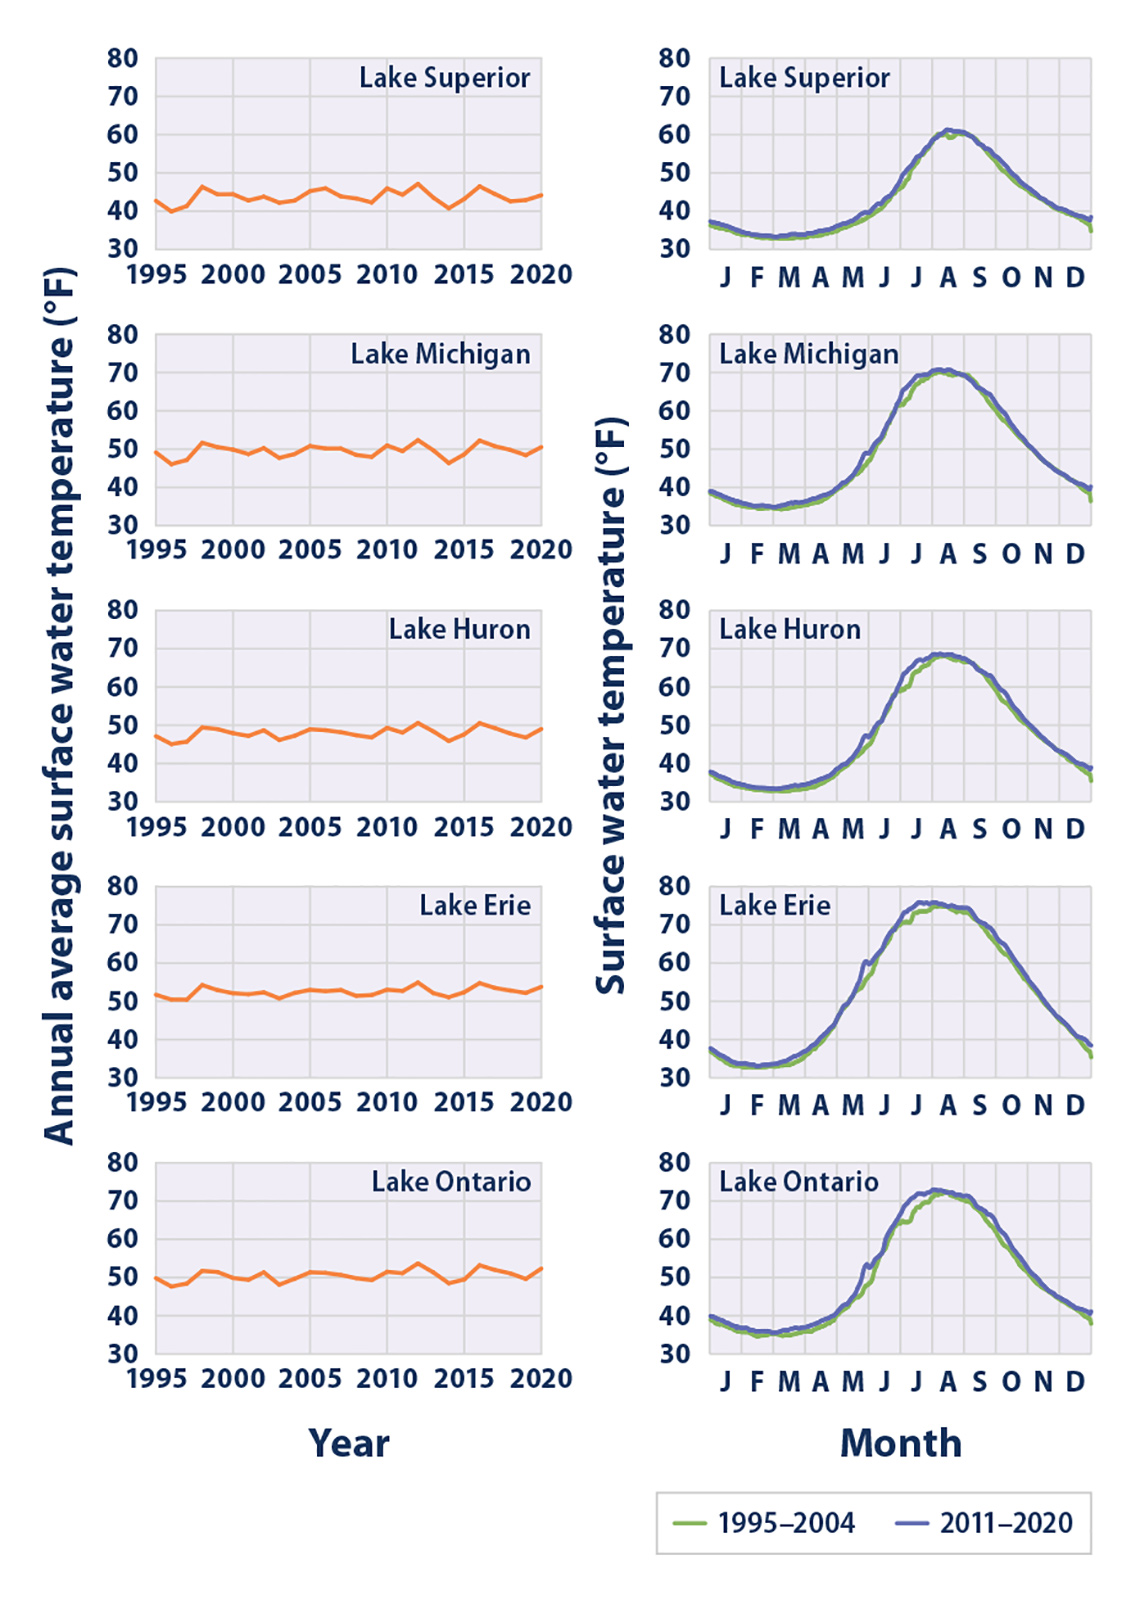
This image shows two sets of graphs. On the first set of graphs, the y-axis is labelled “Annual average surface water temperature (F)” and begins at 30, increasing by 10’s until 80. Along the x-axis is the years 1995 to 2020 in 5 year intervals. The first set of graphs shows each Great Lakes: Lake Superior hovers between 40-50 degrees through the 25 years Lake Michigan around 50 degrees, slightly below and slightly over at times over the 25 years Lake Huron also hovers around 50 degrees Lake Erie hovers mostly above 50 degrees Lake Ontario hovers around 50 degrees, mostly above.
The second graph has the same y-axis. The x-axis is labelled with each month of the year starting at January to December and is titled “Surface water temperature”. All of the graphs for each great lake show the same trend, hovering between 30 and 40 degrees for months January to May. In May and June the temperature starts to rise and continues to rise until it peaks in August. Lake Michigan, Lake Ontario, and Lake Huron peak at 70 degrees, Lake Superior at 60 degrees, and Lake Erie at 75 degrees. Then each graph steadily decreases back to around 40 in December.
Let’s reflect
- What is happening to the surface temperature of the lakes in recent years that is different than before? Why do you think this might be?
Record your ideas in a notebook or another method of your choice.
Did You Know?
Did you know?
Water temperature and water level are two important and connected indicators of climate change in the Great Lakes. As the temperatures rise there is a decrease in yearly ice coverage, which could negatively impact cold-water fish and prevent them from reproducing.
Less ice coverage also reduces the amount and quality of nutrients available to fish. A warmer climate will combine with land-use change and the introduction of invasive species to pose great threats to aquatic biodiversity. These species would interrupt the food chain by taking away a food source from other fish, or introducing new diseases to existing fish. Long-term, this could cause the extinction of currently native species in Lake Erie.
Along with this, lower lake levels with alter the shorelines surrounding Lake Erie and possibly expose habitats to land animals and diminish surrounding wetlands. Native plants and animal species will differ widely in their responses to changing stream temperature. Some will respond by adapting to warmer temperatures, while others will leave in search for a new habitat or decline to extinction, affecting the food web.
Rising temperatures also promote the growth of a harmful bacteria called “cyanobacteria,” which then gets eaten by primary producers and passed through the food web.
So, how do you think climate change is impacting the food chain in the Great Lakes ecosystem?
Record your ideas in a notebook or another method of your choice.
Press ‘Hint’ to access more details.
Think about what the fish do, or what happens to them as the temperature increases.
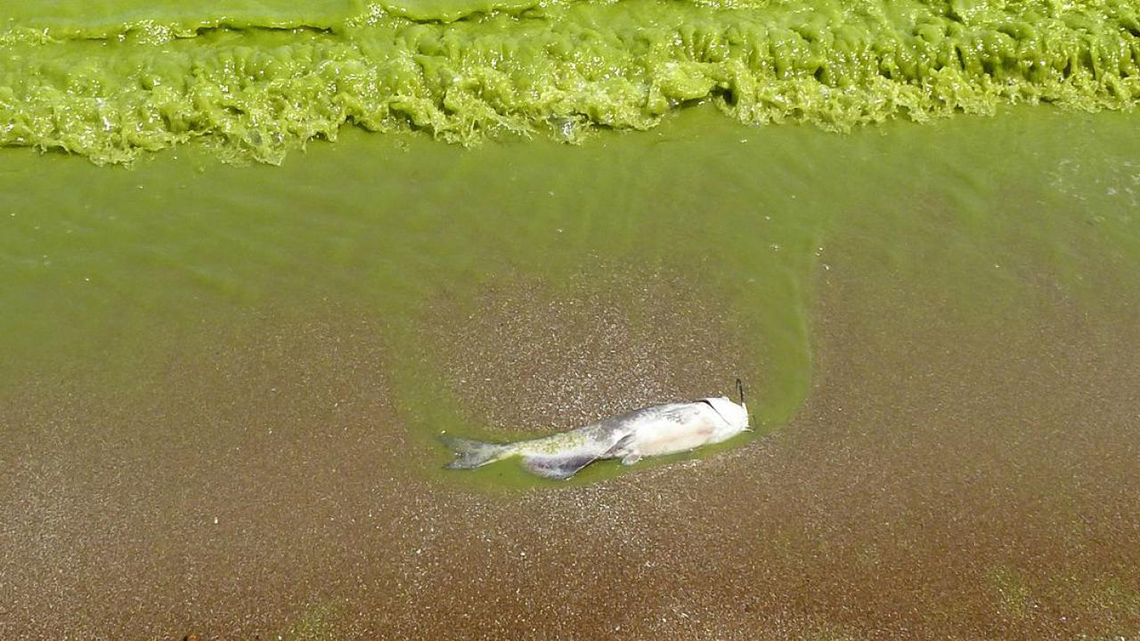
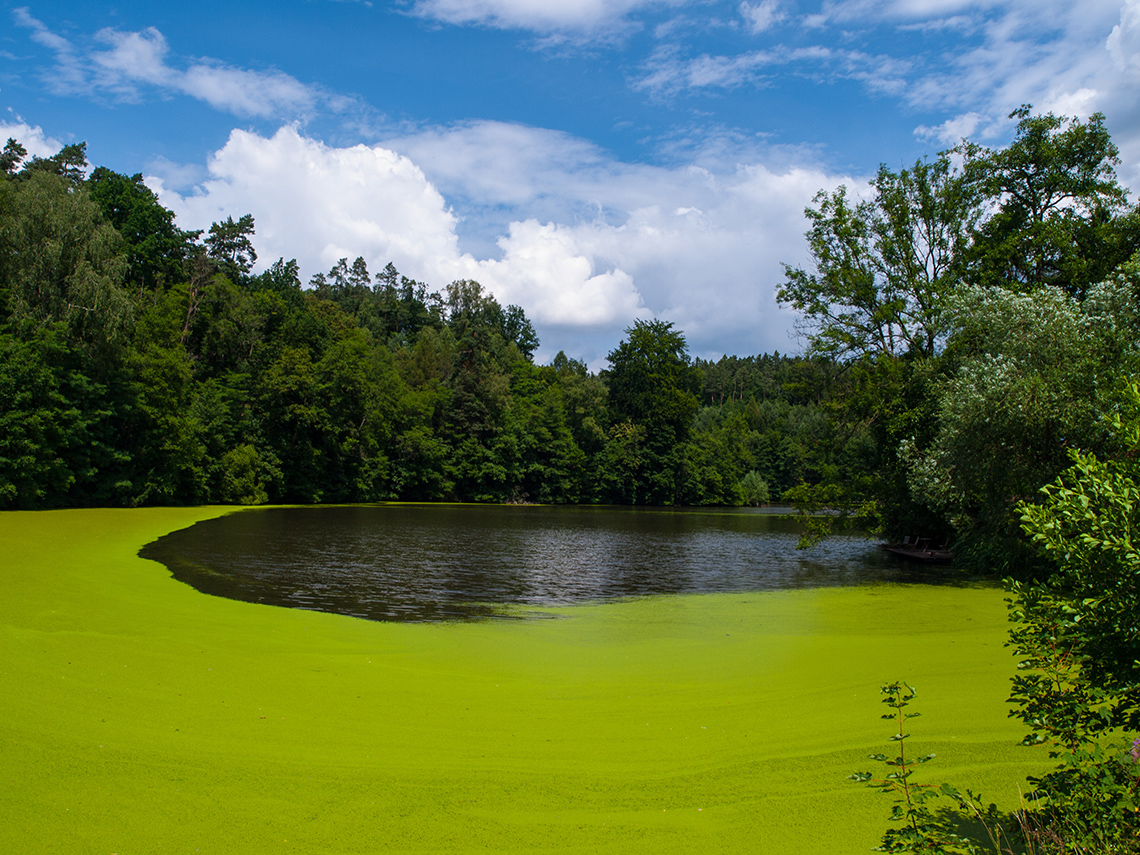
Algae blooms
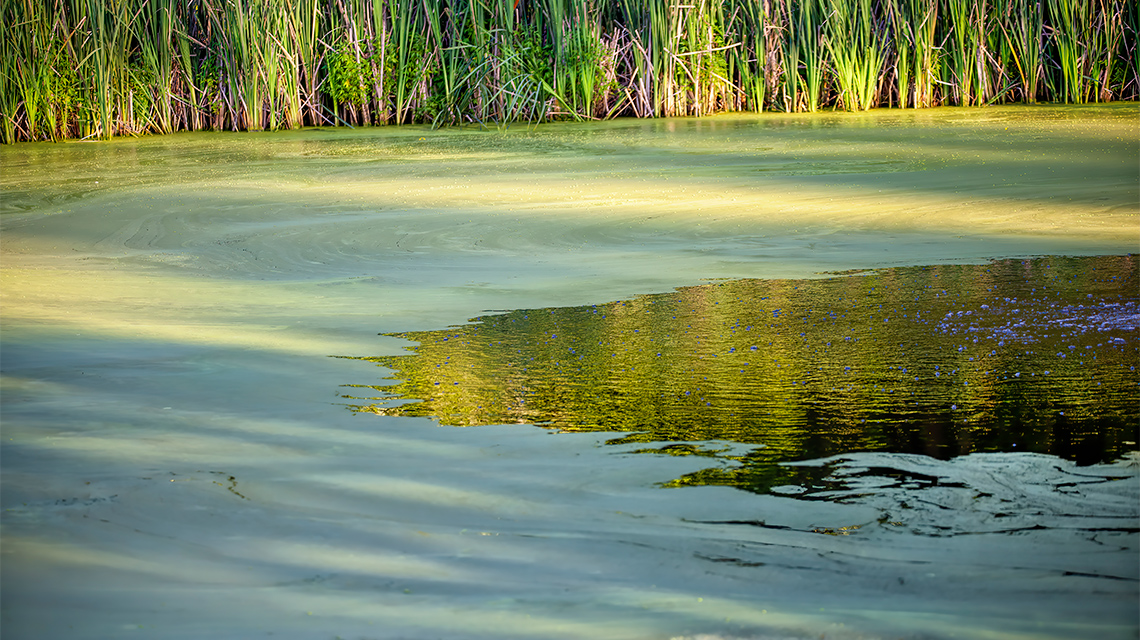
An algae (or algal) bloom is a rapid increase or overaccumulation of algae or algae-like bacteria in water.
Algae blooms are a reoccurring issue in Lake Erie, meaning that they develop more frequently in warmer temperatures. Due to climate change and rising temperatures, algae blooms are getting worse in Lake Erie, which is becoming harmful to the ecosystem and even contaminating drinking water in that area.
So, what causes an algae bloom?
Let’s explore the following video to learn more about how algae blooms form.
Observe and conclude
Before learning more about algae blooms, let’s explore the skills that are in the scientific experimentation process.
Check out this video to learn more about the steps of the Scientific Experimentation Process.
For the following activity, we will be using images and descriptions to make our observations and draw conclusions.
A hypothesis is a possible answer to a question or explanation of a phenomenon that accounts for all of the observed facts.
You can make a hypothesis or prediction by:
- thinking about what you already know about something
- explaining what you think will happen in the experiment
Try It
Your turn!
Explore the following series of images and descriptions. As you are exploring, pause and make observations along the way, using the Algae Blooms Graphic Organizer provided, or another method of your choice to record answers to the following:
- A hypothesis: Which jars will grow an algae bloom? Will one (or more) of the jars grow a larger algae bloom than another? Why?
- Observation after one week: What do you notice about each of the jars? Do you want to update your prediction? Why?
- Observations after three weeks: Are any algae blooms beginning to form? How do you know? What about the plant? Are you able to observe the snails at all?
- Observations after four weeks: What do you observe in each jar now?
|
Time after… |
I notice… (illustrate or record jot notes about how your mixture is changing) |
I wonder… |
|---|---|---|
|
One week |
||
|
Three weeks |
||
|
Four weeks |
Press the ‘Activity’ button to access Algae Blooms Graphic Organizer.
Press the following tabs to access the algae bloom for the Algae Blooms Graphic Organizer.
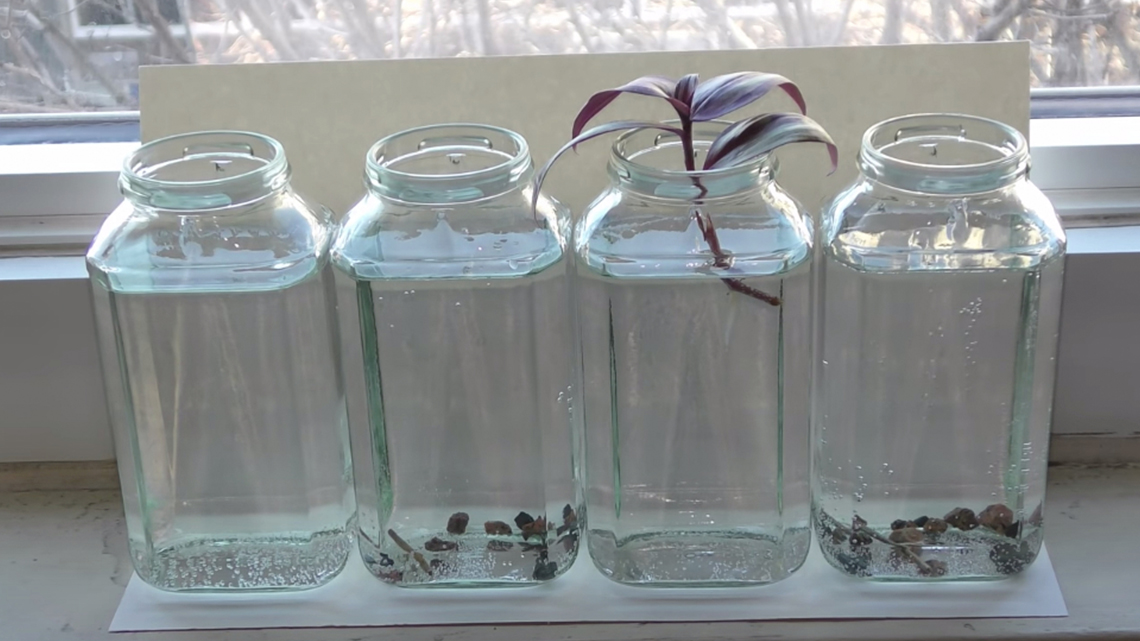
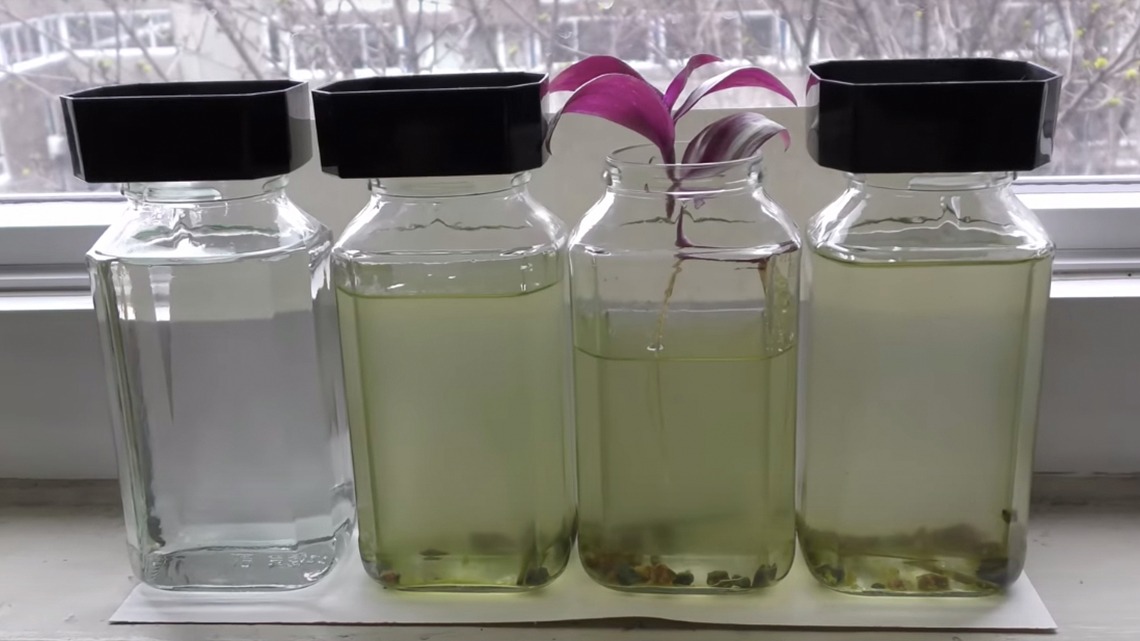
Four jars filled with water. The first jar contains only water, the second jar contains water and small rocks, the third jar contains water and a plant, the last jar contains water and more rocks.
After day one, fish food flakes are added to jar 2, 3, and 4.
Day 2
Make a hypothesis! Which jars will grow an algae bloom? Will one (or more) of the jars grow a larger algae bloom than another? Why?
Record your hypothesis in a notebook or another method of your choice.
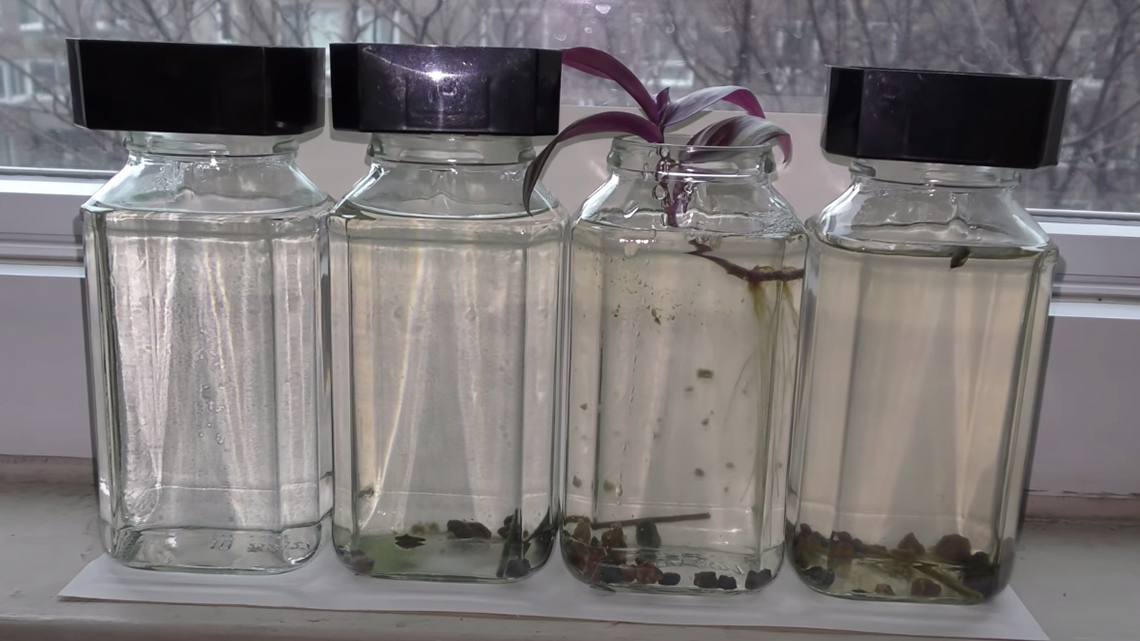
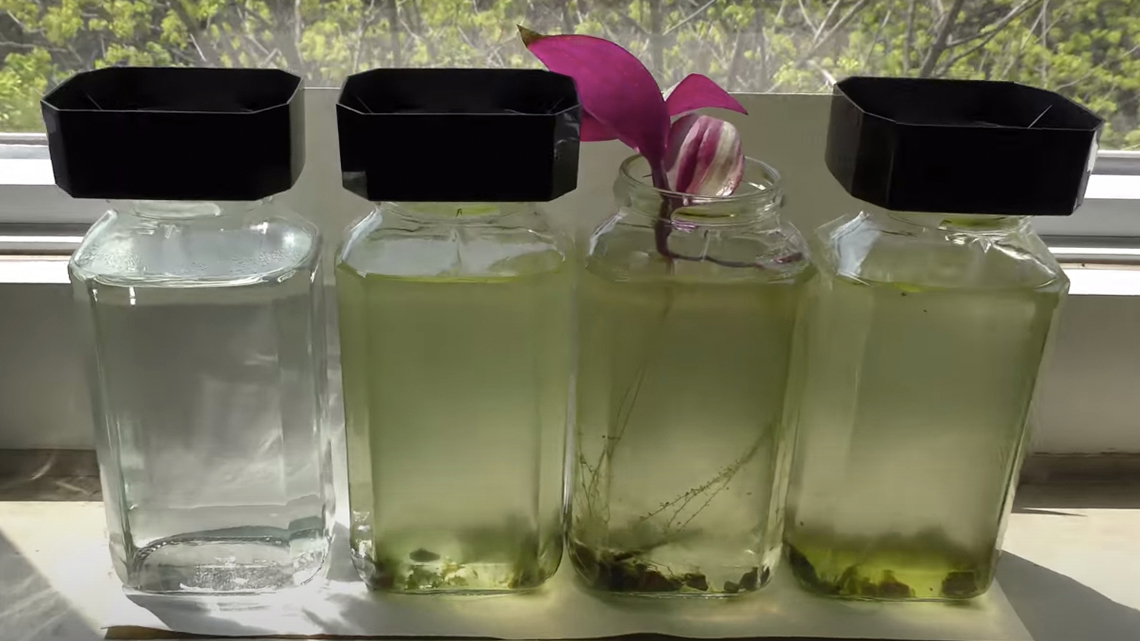
One week later, the jars are topped up with water so that they are all at even levels.
One week later
Update your observations. What do you notice about each of the jars now? Do you want to update your prediction? Why?
Record your ideas in the Algae Blooms Graphic Organizer or another method of your choice.
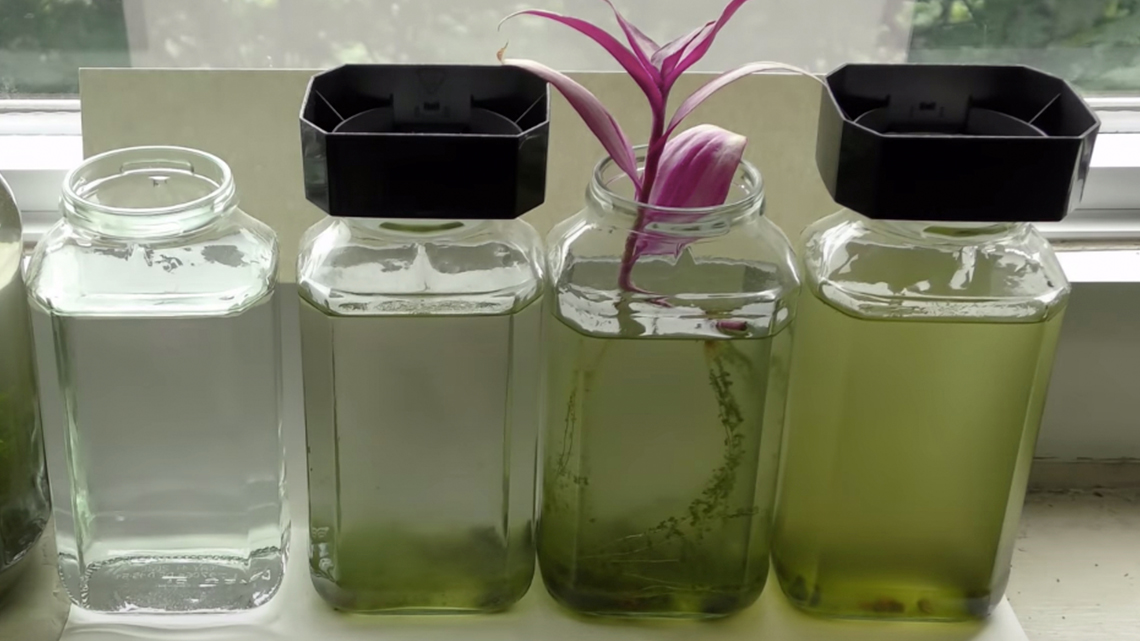
Three weeks later, check out the following image.
Three weeks later
Update your observations. Are any algae blooms beginning to form? How do you know? What about the plant? Are you able to observe the snails at all?
Record your ideas in the Algae Blooms Graphic Organizer or another method of your choice.
Four weeks later – what do you observe in the jars now?
Four weeks later
Specifically investigatethe bottom of the jars and root of the plant. Do any of the jars appear to have more algae than another?
Record your ideas in the Algae Blooms Graphic Organizer or another method of your choice.
What do you think?
After making your observations and conclusions, reflect on the following questions:
- Based on your observations, how do algae blooms form?
- What conditions are needed for an algae bloom to form and stay?
Record your ideas in a notebook or another method of your choice.
Reading Time
Algae blooms and Lake Erie
In 2011, Lake Erie experienced the largest harmful algae bloom in its recorded history, with a peak intensity more than three times greater than any previously observed bloom.
In 2014, 500,000 people in the Toledo area were without safe local drinking water supplies for 72 hours because of toxic algae blooms in western Lake Erie.
Algae blooms will likely become more frequent in the future as higher temperatures and heavy precipitation mix heavy nutrient loads with warmer waters. These pollutants have dramatically raised the cost of water treatment for the area. Nutrient runoff gathers rapidly within the Great Lakes and feeds large algae blooms, which raises the cost of water treatment.
Explore the following article to further investigate why algae blooms are harmful.
Press tvo today to access Why Lake Erie’s annual algae bloom is a serious threat—and so hard to stop.
TVO dot org (Opens in a new tab)Learning check!
Select the correct answer, then press ‘Check Answer’ to see how you did.
Algae bloom aftermath
As algae blooms become a bigger issue, innovative technologies aimed at preventing and treating them become more prevalent. It is important to focus on reducing pollution, which fuels algae blooms.
However, when they do pop up, it is important to address them and improve water quality. In Ontario, the Thames River Phosphorus Reduction Collaborative is installing and testing technologies that intercept and remove phosphorus from agricultural runoff to protect against harmful algae blooms in the Thames River and Lake Erie.
Southwest farmers in Ontario are also taking steps to discover how phosphorus that fuel Lake Erie’s algae bloom can be reduced to levels that won’t cover the lake in green slime. Farmers recognize that practices need to change, and they are looking for further research to guide them. In Ontario, some changes that have already been made, such as regulating the spread of manure on frozen fields. This spreading causes the manure to sit on top of the field, then when it rains in the spring the manure is washed off the frozen ground and into the watershed.
Reading Time
The plan
Ontario is concerned about the effects of blue green algae blooms in our lakes and rivers. Ontario has a 12-point plan outlining how they are fighting algae blooms in the Great Lakes.
Press ‘Let’s Check!’ to explore a summary of the Ontario 12-point plan.
Explore the following summary of the algae bloom 12-point plan:
- collaborate with partners to reduce and address algae blooms
- reduce nutrients that are entering the waters
- protect drinking water sources, especially those near possible algae blooms
- conducting innovative research on how algae blooms can be reduced
- investing money to improve the health and water quality of lakes and rivers
- putting programs and policies in place to protect water (i.e., Great Lakes protection act)
- outlining water quality standards
- monitor water drinking systems
- working with public health to test for potential toxins
- creating back up plans to keep drinking water safe
- working with scientists in laboratories to test algae and water
- offering courses that teach operators how to identify, respond, and address potential algae
Source: Blue-green algae. (n.d.-a). ontario.ca. https://www.ontario.ca/page/blue-green-algae
Consolidation
Review your learning
At the beginning of this learning activity, you completed part of the Great Lakes and Climate Change Activity chart.
Now, let’s refer to the Great Lakes and Climate Change Activity chart to complete the following questions:
- What is confirmed?
- What was a misconception (something you believed was not actually true)?
- What new information did you learn?
- How is climate change impacting the Great Lakes?
- How does climate change impact food webs?
Continue to record your ideas and thoughts in the Great Lakes and Climate Change Activity chart or another method of your choice.
Pause and Reflect
Pause and reflect
Throughout this learning activity, you learned a lot about the Lake Erie ecosystem and the threats to the living organisms in this ecosystem.
Choose three of the following questions to reflect on:
- Why are algae blooms such a threat to the Lake Erie ecosystem?
- Why do threats such as algae blooms need to be monitored and solved as soon as possible?
- How can threats such as algae blooms affect food chains in Lake Erie?
- How did observing the experiment with the algae blooms over time help you understand this phenomenon?
- How do you think algae blooms are impacting the food chain in the Great Lakes ecosystem?
Record your ideas in a notebook or another method of your choice.
Reflection
As you read the following descriptions, select the one that best describes your current understanding of the learning in this activity. Press the corresponding button once you have made your choice.
I feel…
Now, expand on your ideas by recording your thoughts using a voice recorder, speech-to-text, or writing tool.
When you review your notes on this learning activity later, reflect on whether you would select a different description based on your further review of the material in this learning activity.