Minds On
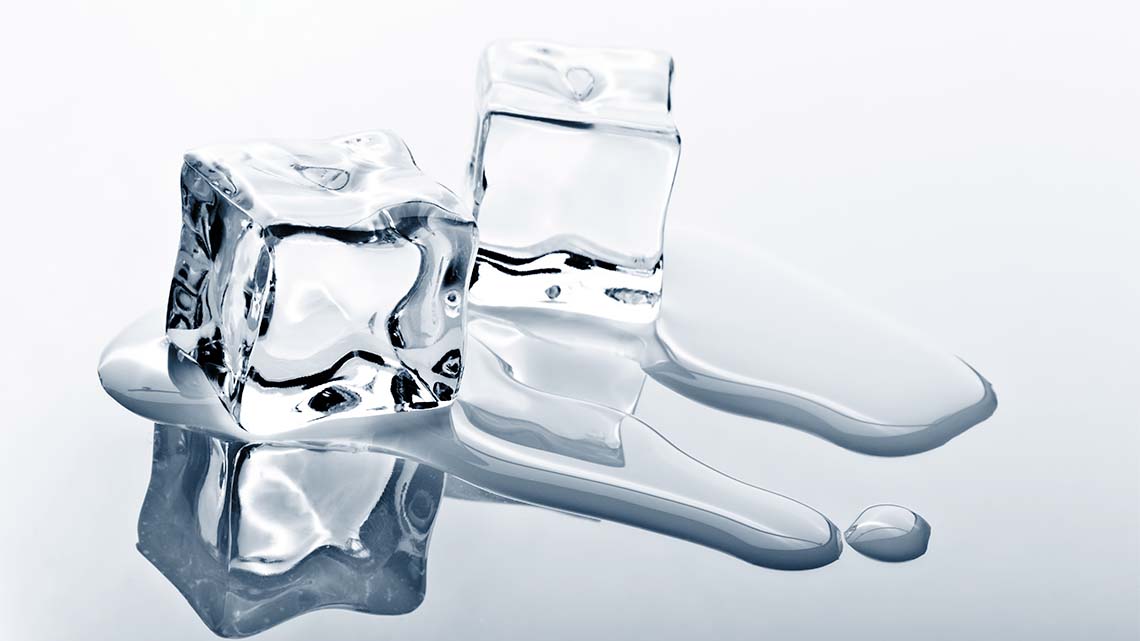
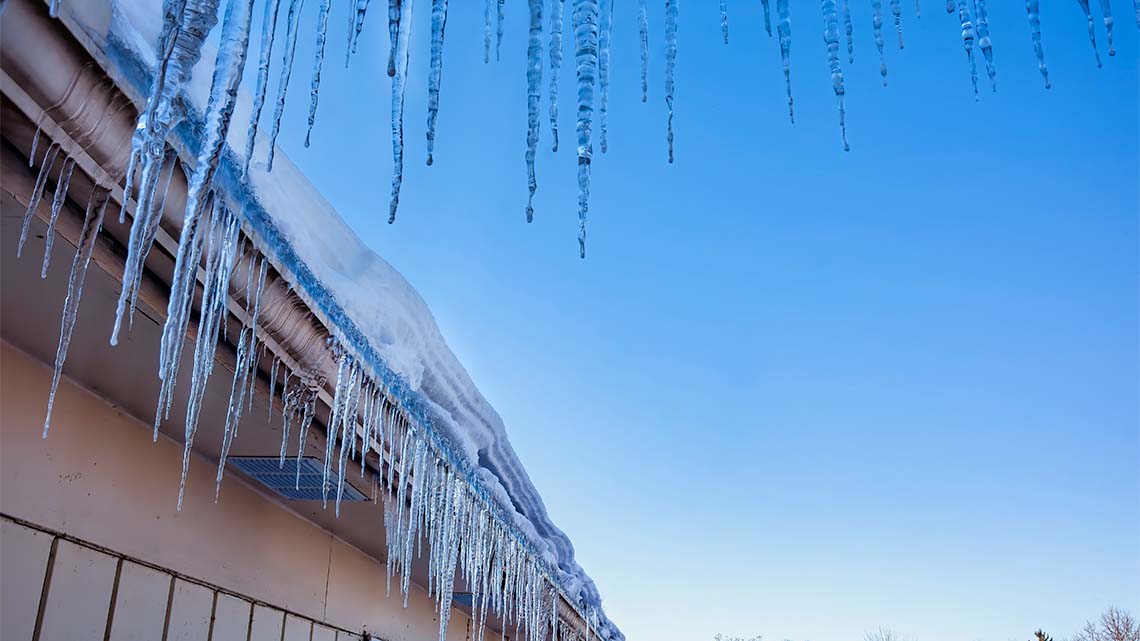
Changing states of matter
There are three states of matter.
Explore and respond to the following questions:
What are the three states of matter?
How can one state of matter change into another state of matter? Provide at least three examples of this change.
You may explore the following images to guide your thinking and responses.
Record your ideas in a notebook or another method of your choice.

Brainstorm
Brainstorm
Let’s brainstorm about the following:
- How do you think tire pressure is connected to fuel efficiency?
- Why is it important for our planet to improve fuel efficiency?
Record your ideas in a notebook or another method of your choice.
Press ‘Hint’ to access a definition.
Fuel efficiency is an engine’s ability to obtain energy from fuel.
Action
Particle theory
Explore the following video to learn about Particle theory.
As you explore, record key information in the “Key Information Graphic Organizer” provided, or in another method of your choice. If you would like, you can use speech-to-text or audio recording tools to record your thoughts.
|
Solid |
Liquid |
Gas |
|
|---|---|---|---|
|
Diagram / Drawing of Particles |
|||
|
Real Life Examples |
|||
|
What happens when heated / cooled? |
Press the ‘Activity’ button to access Key Information Graphic Organizer.
When you’re ready, press ‘Let’s Check!’ to access a possible response.
|
Solid |
Liquid |
Gas |
|
|---|---|---|---|
|
Diagram / Drawing of Particles |

|

|

|
|
Real Life Examples |
Desk, ice, tire, chair, wall |
Water, milk, blood, juice, etc. |
Blowing up a balloon, air inside a tire, carbon dioxide |
|
What happens when heated / cooled? |
Heat up a solid and particles move faster, until they reach a state of liquid. For example, ice cream melting. |
Cool down a liquid and the particles slow down. |
You can cool down a gas so much that it becomes a solid. |
Investigate
Investigate
Let’s investigate the following graph.
This graph displays the height of sea water in a specific body of water over a timespan of 15 years, beginning in 1995.

This graph shows sea level observations between 1993 and 2020. On the left side, y-axis, it is labelled “Sea Height Variation” beginning at the number 0 and increasing by 20 up to 100. On the bottom, x-axis, it begins with the year 1993 and increases 5 years at a time to 2020. 1993 shows 0mm variation, 1995 increases to approximately 17mm variation, 2000 to 22mm variation, 2005 to 40mm variation, 2010 to 58mm variation, 2015 to 67mm variation, and ends with 2020 at approximately 96mm variation. The graph appears to be climbing higher, even after 2020 off the graph.
After exploring the graph, consider the following:
- What do you notice? What do you wonder?
- What conclusions can you draw from this graph?
Record your ideas in a notebook or another method of your choice.
When you’re ready, press ‘Let’s Check!’ to access possible conclusions.
You may have included the following possible conclusions:
- Sea levels have been steadily increasing since 1993.
- There were a few instances, in 1998 and 2012, where sea levels dipped down a little, but then rose again after.
- The line appears to be getting steeper, even after 2020.
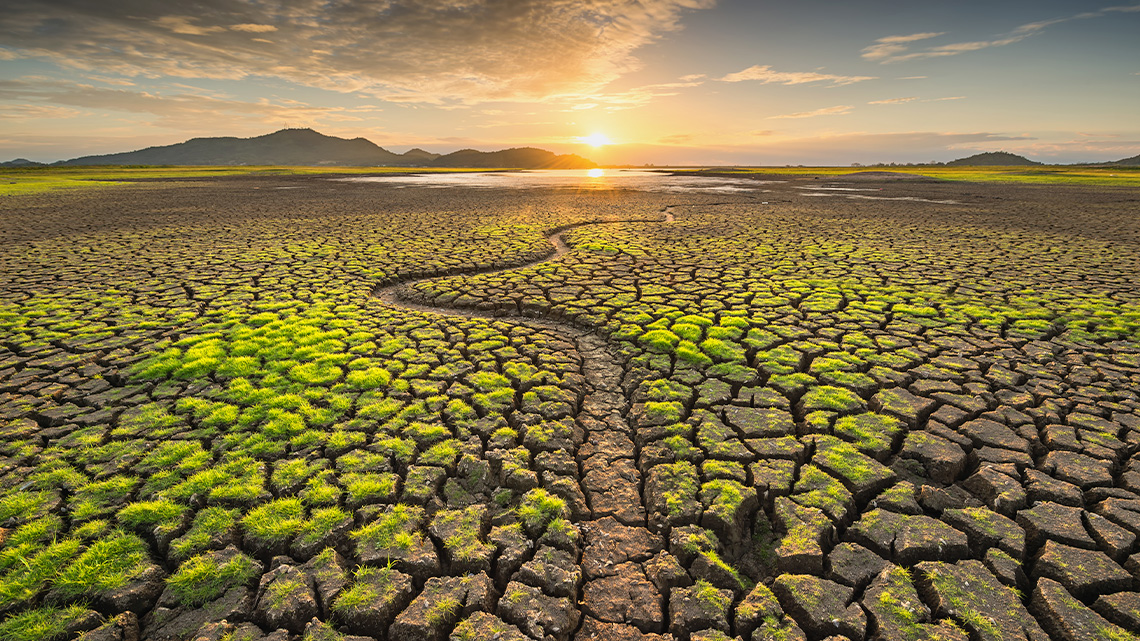
Matter in a changing climate
Press the following tabs to access how the states of matter are affected by changing climate.
Particles experience the effects of temperature in the form of agitation. If you zoomed in on the molecules of a solid, you would notice that they are a greater distance apart when heated, which is called “expansion.” As temperatures increase, materials increase in volume. To the opposite effect, a decrease in temperature results in “contraction.”
As you explored in the previous graph, sea levels are rising.
Why are sea levels rising and why do we care?
In the following section, we will be observing one of two science experiments to better understand why sea levels are rising.
Recall what you have learnt from the previous section and consider the following:
- How do you think tire pressure is impacted by temperature?
- What do you think happens to your tire pressure when the season changes from summer to fall to winter?
Record your ideas in a notebook or another method of your choice.
Press ‘Let’s Check!’ to access the correct responses for tires of pavement.
When the temperature is high, the air in your tires take up more volume. The pressure increases.
As the temperature gets cooler, the air pressure in your tires will decrease. A car might then indicate that tires are low on air. As the car is driven, the tires warm up and the tire pressure may increase. This is just one example of how gas particles change based on the temperature.
Driving with lower tire pressure requires more fuel to move the vehicle. One small change that drivers can do to help climate change is to use less fuel by keeping their tire pressure at the right level.
Let’s predict and observe!
There will be two experiments to explore. You may choose to predict and make observations for one or both of the following options:
- Option A: Heat and the Earth
- Option B: Warming water
Predicting and making observations are two parts of the Scientific Experimentation Process.
Before you begin, explore this video to learn more about all the steps of the Scientific Experimentation Process.
Let’s begin by making a hypothesis (or prediction) about why you believe sea levels are rising.
Complete the Hypothesis Organizer in your notebook or record your ideas using the following fillable and printable document. If you would like, you can use speech-to-text or audio recording tools to record your thoughts.
|
Ask a question |
Example: Why are sea levels rising? |
|---|---|
|
Construct a hypothesis A hypothesis is a possible answer to a question or explanation that accounts for all the observed facts and is testable. |
Record your hypothesis here: I believe sea levels are rising because … |
Press the ‘Activity’ button to access Hypothesis Organizer.
Safety reminder
If you choose to try any experiment yourself, always make sure to first check in with a trusted adult as some experiments may use materials that require some extra help and supervision, such as lighting a candle.
Choose one, or both, of the following experiment demonstrations to explore and record your observations on.
Investigate
Option A: Heat and the Earth
-
Check out the following video to explore, predict, and make observations about the experiment, “Heat and the Earth.” You may pause the video to record your observations.
-
Notice the following:
- What happened to the balloon filled with air when there was a flame held really close to it?
- What happened to the balloon filled with water when there was a flame held really close to it?
You may use the following fillable and printable document Observation Organizer. If you would like, you can use speech-to-text or audio recording tools to record your thoughts.
My Observations What happened to the balloon filled with air when there was a flame held really close to it? What happened to the balloon filled with water when there was a flame held really close to it? Press the ‘Activity’ button to access the Observation Organizer.
What do you think?
Reflect on the following questions for Option A:
- What does this experiment demonstrate about how air and water absorb heat?
- How do you think this connects to our rising sea levels?
Record your ideas in a notebook or another method of your choice.
When you’re ready, press ‘Let’s Check!’ to access a possible response.
This demonstration shows how Earth’s oceans are absorbing more heat than air as a result of climate change. As water molecules heat up, they become more energetic and move faster. This faster movement causes the water to expand and take up more room, accounting for the rise in sea levels. The increase in heat also causes polar ice caps and mountain glaciers to melt, adding more water to large bodies of water.
Investigate
Option B: Warming water
-
For this option, you will be exploring an experiment conducted by Learning Space at NASA. As you are exploring the video, record your observations.
-
Complete the Observations Chart in your notebook or by using the following fillable and printable document. If you would like, you can use speech-to-text or audio recording tools to record your thoughts.
Make a drawing of your experiment and show on your drawing the different levels of water at different intervals.
You may use the following fillable and printable document Observation Organizer. If you would like, you can use speech-to-text or audio recording tools to record your thoughts.
My Observations Make a drawing of your experiment and show on your drawing the different levels of water at different intervals. Press the ‘Activity’ button to access the Observation Organizer.
What do you think?
Reflect on the following questions for Option B:
- What happened to the water level as the water was heated?
- What caused the water level in the straw to change over time?
- How do you think this relates to rising sea levels?
Record your ideas in a notebook or another method of your choice.
When you’re ready, press ‘Let’s Check!’ to access a possible response.
As the water was heated, the level of the water rose. Energy is added from the heat which causes the water molecules to move around more. As they move, they bounce off each other and take up more space, therefore increasing the volume of the water, causing it to rise. This process is called thermal expansion.
This is connected to sea levels rising because CO2 emissions cause higher temperatures, which creates thermal expansion and therefore the sea levels rise. Melting ice also contributes to this.
Ontario connection
This learning activity highlights people, places, or innovations that relate directly to the province of Ontario. Enjoy the exploration!

Why should we care?
Does an overall change in temperature affect the Great Lakes?
As temperatures rise, it can affect the amount and intensity of snow and rainfall in the areas around the Great Lakes. This may an increase or decrease water levels. Fluctuation of water levels affect the entire ecosystem around the lake creating imbalances that affect plants, animals, microorganisms. It also affects the people who rely on the lake.
Pause and Reflect
Pause and reflect
What small changes can people make in their lives to reduce the impacts of climate change? Brainstorm a list of ideas.
Record your thoughts and ideas in a notebook or another method of your choice.
Consolidation
Review your learning
Select the correct answer, then press “Check Answer” to see how you did.
Show what you know!
Using one of the following options, show what you learned about the particle theory and how it is connected to climate change. You may wish to focus on just solids, liquids, or gases – or all three!
|
Write a poem, song, or rap 
|
Create a poster in print or digitally 
|
|
Write a newspaper article 
|
Create a piece of art with a written or audio explanation 
|
|
Complete a short written or digital essay 
|
Create a blog post or podcast episode 
|
You may use the following checklists to guide your presentation piece.
You presentation should include:
When investigating, did I communicate my learning by…?
Reflection
As you read the following descriptions, select the one that best describes your current understanding of the learning in this activity. Press the corresponding button once you have made your choice.
I feel…
Now, expand on your ideas by recording your thoughts using a voice recorder, speech-to-text, or writing tool.
When you review your notes on this learning activity later, reflect on whether you would select a different description based on your further review of the material in this learning activity.