Minds On
Maps
Let’s explore a map of Canada!

This is a map of Canada. The map has all ten provinces and three territories. From left to right, or from the west coast to the east coast, the provinces are: British Columbia, Alberta, Saskatchewan, Manitoba, Ontario, Quebec, New Brunswick, Prince Edward Island, Nova Scotia, and Newfoundland and Labrador. The territories are on top of the provinces. Moving from the west to the east, the territories are: Yukon, Northwest Territories, and Nunavut.
Brainstorm
What do you think?
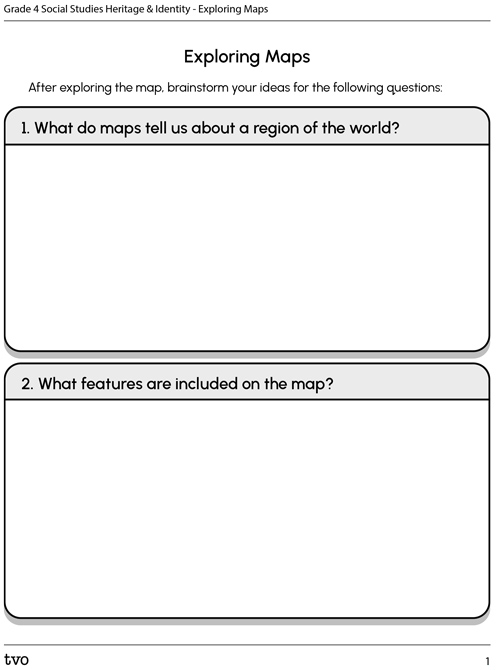
After exploring the map, brainstorm your ideas for the following questions:
- What do maps tell us about a region of the world?
- What features are included on the map?
- How can we identify the different regions of Canada on the map?
Complete the Exploring Maps activity in your notebook or using the following fillable and printable document. If you would like, you can also use a method of your choice.
Action
Early societies and maps
Maps have existed for thousands of years and were used by early societies to mark the boundaries of their empire and locate towns and trade routes.

Maps can also indicate the physical features of a region and indicate directions:
North East South West (N E S W).
The earliest maps can be dated to several thousand years ago and were engraved in stone tablets, carved in temples, and later drawn on paper. The boundaries of the maps eventually grew over time as more cultures interacted, and the true size and scale of the world was recognized.
Let’s explore a modern map of the world and then several ancient maps.

This is a map of the entire world with all seven continents, from left to right, or west to east. On the west side of the map is North America and South America. In the middle of the map, there is Europe and Africa. On the east side of the map is Asia and Australia. Lastly, extending from west to east is Antarctica on the very bottom.
The modern map of the world includes the seven continents: North America, South America, Africa, Europe, Asia, Australia, and Antarctica. Within the continents, regions are divided into a total of 195 countries or nation-states.
Maps have changed a lot over the centuries. Let’s consider how earlier maps compare with modern maps.
Ancient Greek
Let’s examine the following ancient Greek world map:
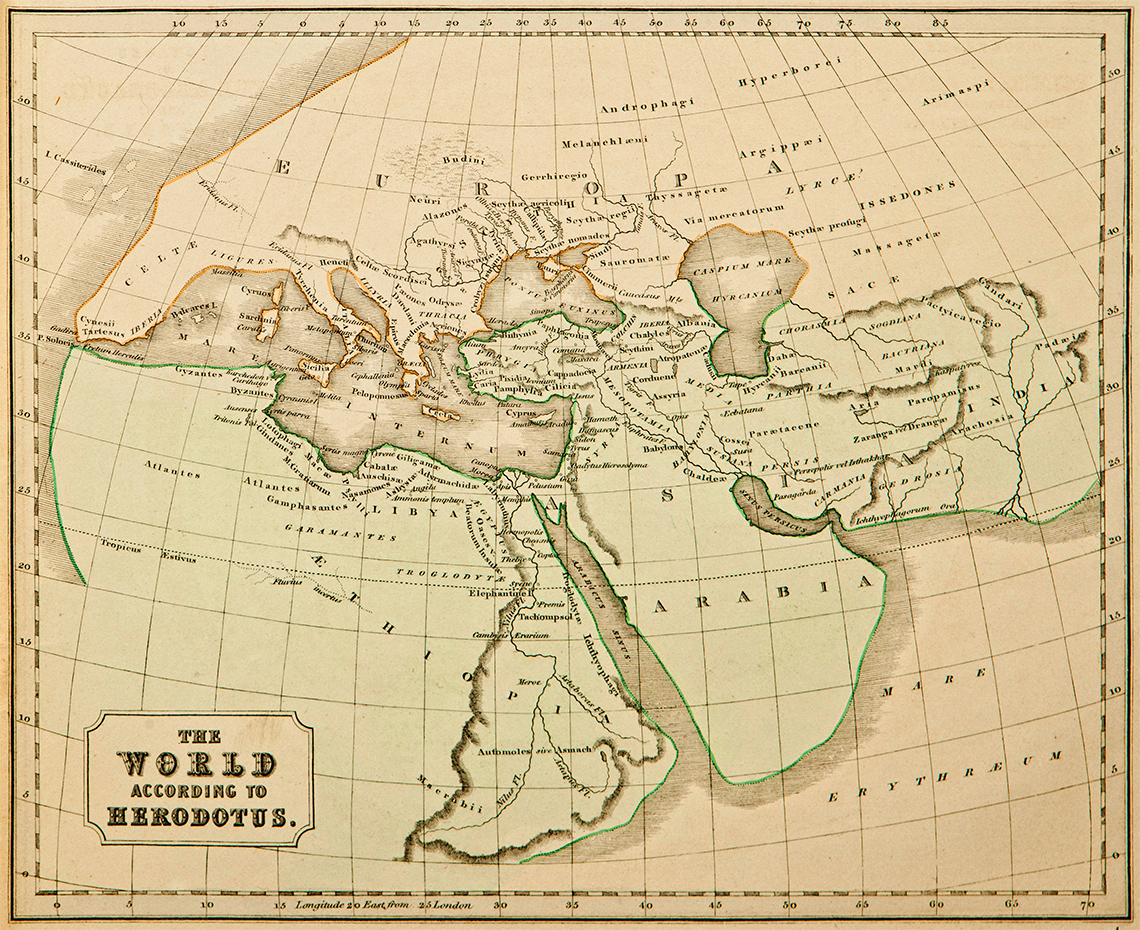
The World According to Herodotus, 450 BCE
The map is of the known world from the ancient Greek perspective created by Herodotus in 450 BCE. It illustrates Europe, parts of Africa, and Asia. Although, Africa is not mentioned, it was frequently referred to as Libya, and Herodotus used the term Ethiopians. As for Asian, he only goes as far to the east, which is India.
Brainstorm
What do you think?
After exploring the map, reflect and respond to the following questions:
- What regions of the world are missing on this map?
- Why does this map only include a small part of the world?
Record your ideas in a notebook or a method of your choice.
Press ‘Hint’ to access additional prompts to help guide your thinking.
Check out the following hints:
- Think of the seven continents we now include in modern maps.
- Based on available technology, were the Greeks in contact with peoples that were geographically far away across oceans? For example, the First Nations in North America?
Sumerian
Let’s explore the following ancient Sumerian map:

Sumerian Map of Nippur, 1500 BCE
The Sumerian map illustrates Nippur in 1500 BCE. This map is a clay tablet from the Kassite period of Babylonia. It is engraved with lines, drawings, and buildings with titles.
Let’s think!
After examining the Sumerian map, reflect and respond to the following questions:
- What features do you notice on the map?
- How do you think the map was made?
Record your ideas in a notebook or a method of your choice.
Press ‘Hint’ to access additional prompts to help guide your thinking.
Check out the following hints:
- Examine the lines and drawings.
- Which tools do you think were used to make the markings in the rock?
Ancient Chinese
Let’s analyse the following ancient Chinese map of the world:
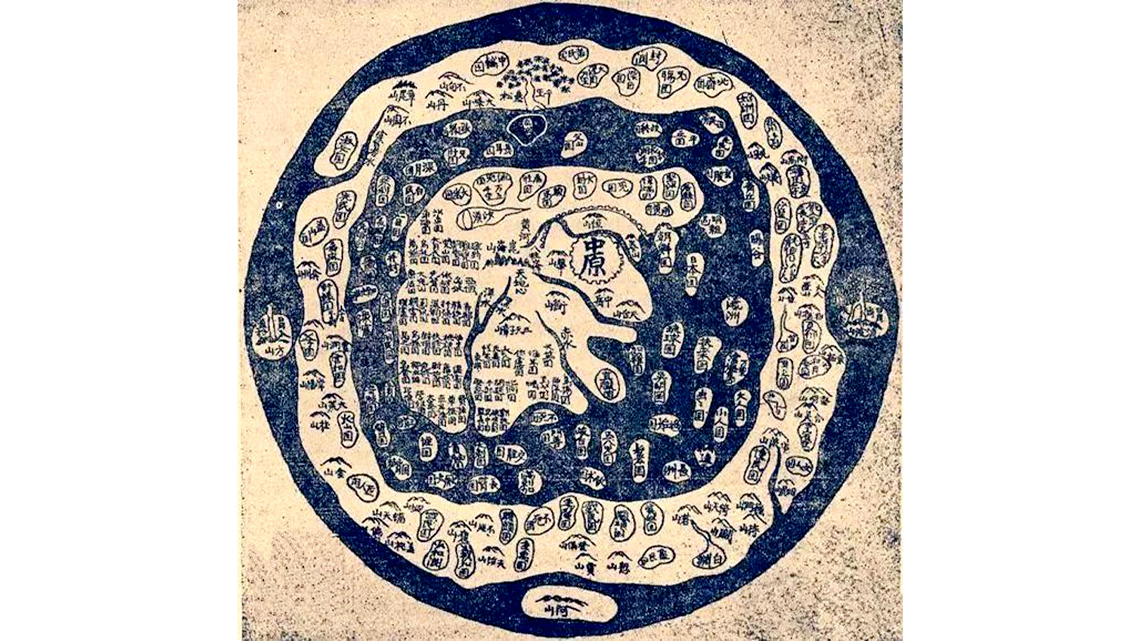
Ancient Chinese Map from about 1000 BCE
The map is based on Chinese mythology and comes from the ancient book, Classics of Mountains and Oceans. It shows a mythological figure in the middle with little islands surrounding its head. There is another land mass around those islands, which is surrounded by what appears to be water with three islands. Everything is presented in a circle with blue water surrounding everything.
I wonder…
After examining the ancient Chinese map, reflect and respond to the following questions:
- What details are included in the map?
- What does the map have in common with the Greek map and the Sumerian map?
Record your ideas in a notebook or a method of your choice.
Press ‘Hint’ to access additional prompts to help guide your thinking.
Check out the following hints:
- What could the circle-like shapes represent?
- Do you think it includes the entire world as shown in modern maps?
Indigenous trade routes
Maps can also focus on one detail. For example, the following maps concentrate on the Indigenous trade routes.
Let’s explore the following map of Indigenous trade routes in Ontario and Quebec.
As we work towards Truth and Reconciliation, information about lands and territories is constantly being updated. This map was created using information available as of July 2021 from the Cree Nation of Waskaganish.

This is a trade route map in northern Ontario and Quebec used by the Ojibwe, Achirigouan, Nipissing, Algonquin, and Montagnais First Nations prior to and after contact with European settlers. There are five routes illustrated in this map: 1. The Ojibwe’s route started from the coast of Lake Superior, and heads north east through the Albany River to James Bay. 2.The Achirigouan’s route began from the outskirts of Georgian Bay, and heads north through the Moose River to James Bay. 3.The Nipissing’s route started from Lake Nipissing, and heads north through the Moose River to James Bay. 4.The Algonquin’s route began from the St. Lawrence River, and heads north west through the St. Maurice and Nottaway River to James Bay. 5.Lastly, the Montagnais’ route started from the St. Lawrence River, and heads west through the Saguenay and Rupert River to James Bay.
Interactive
Please press the following link entitled Interactive Map(Opens in a new window) to access the interactive Indigenous trade routes map in Alberta.
This interactive map is based on Indigenous oral traditions (the stories passed on from one generation to the next about past events) and European accounts.
When using this map, click on traditional territories, river systems, and trade routes. The result shows that trade routes and rivers were deeply connected.
After exploring the interactive map, consider:
- What do all of the routes have in common?
Press ‘Hint’ to access an additional prompt to help guide your thinking.
Hiawatha Belt
The Hiawatha Belt, which is the wampum belt, has information on the relationship between the members of the Haudenosaunee, including the Seneca. The belt has five symbols woven from white beads, each one representing a member of the Haudenosaunee. From left to right: the Seneca Nation, the Cayuga Nation, the Onondaga Nation, the Oneida Nation, and the Mohawk Nation. The sixth nation, Tuscarora Nation, joined after the belt was created.
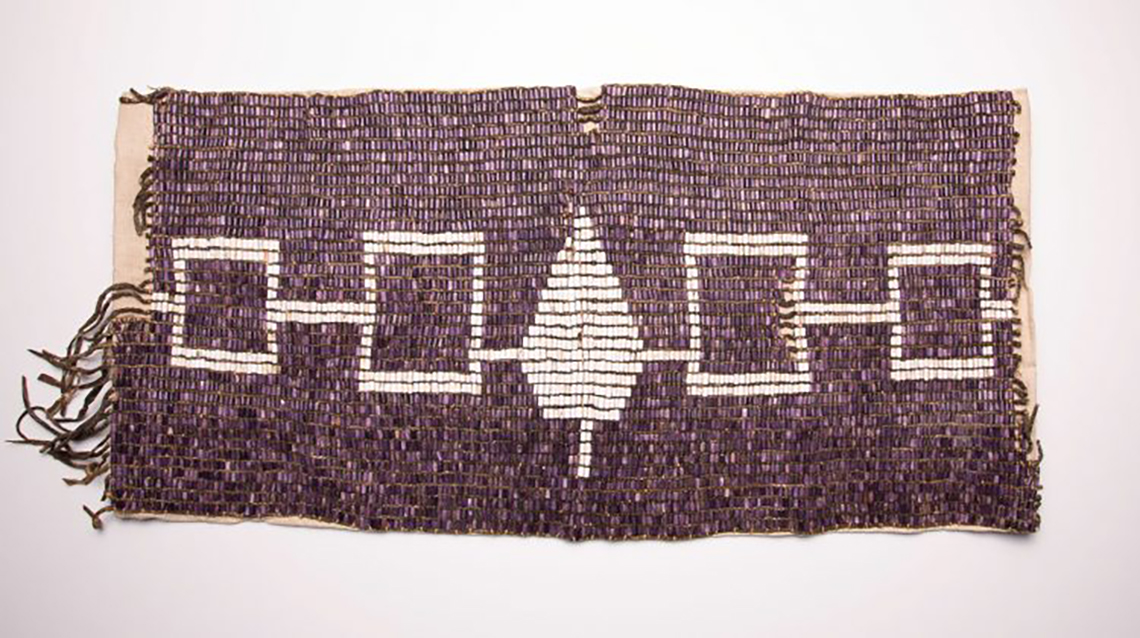
The Hiawatha Belt has five symbols woven from white beads: a small square, big square, tree, big square, and small square.
The Hiawatha Belt represents the unity between the five original Haudenosaunee nations, which were connected by the Great Law of Peace. The tree in the center and each white square represents one of the original five nations.
The Hiawatha Belt served as a map, with the Seneca being the most western nation in the confederacy known as the “Keepers of the Western Door.” Since the Onondaga were geographically located in the center of the group of Nations, it was known as the “Keepers of the Central Fire,” and the heart of the Five Nations loyal to the Great Law of Peace. The Mohawk Nation, being the most easterly, was known as the “Keepers of the Eastern Door.”
What do you think?

After exploring the various kinds of maps from several societies, what information do we need to have in order to understand the information we get from maps?
Record your ideas in a notebook or a method of your choice.
Press ‘Let’s check!’ to access a few possible answers.
- We need to understand the meanings of the images to local cultures.
- We need to understand the locations shown on the map.
- We need to understand the purpose of the map and how to take information from the map.
Mapping skills
Let’s review our mapping skills!
Explore this video entitled “Maps” to learn more about how to read a map, and the importance of a compass.
After exploring the video, reflect on the following questions:
- Why do you think maps are important?
- How do maps help us understand a society or specific moment in history?
- How can the location of an early society affect life in that society?
Record your ideas in a notebook or a method of your choice.
Locating early societies
In order to understand how climate and the physical environment can affect an early society, it is important to locate these societies.
You can refer to the map at the beginning of the Action section in order to review the location of the continents and the countries.
Then, using a blank world map, let’s explore the following steps:
- Name the 7 continents and identify them on a map. This will help to understand where in the world these early societies are located.
- Locate and label the following countries: Canada, the United States of America, Greece, Iraq, China, India, Ethiopia, Peru, Mexico, and Thailand.
Complete the Mapping Early Societies activity in your notebook, in the following fillable and printable document, or in a method of your choice.
Press the ‘Activity’ button to access Mapping Early Societies.
Mapping Early Societies
Map Labelling Checklist

Use the following checklist to guide you as you complete your design, and then show it to your teacher or guardian.
I have labelled…
Pause and think!
- What and where is the equator?
- What directions do the letters N, S, E, W represent on a compass?
- Why are these directions important?
Record your ideas in a notebook or a method of your choice.
Press ‘Let’s check!’ to access more details.
Physical geography and early societies
Reflect on the countries you explored in the previous activity.
Now, consider what the climate and physical landscape may be for the communities living in those countries:
- Canada
- The United States of America
- Greece
- Iraq
- China
- India
- Ethiopia
- Peru
- Mexico
- Thailand
Respond to the following questions:
- How close or far away from the equator were they?
- What would the climate have been like in these areas?
Record your ideas in a notebook or a method of your choice.
Student Tips
Did you know?

Equator line dividing the Earth horizontally in half.
The closer a country is to the equator, the warmer it is.
For example: Mexico
So, the further away from the equator, the colder it is.
For example: Antarctica
Parts of a map
Press the following tabs to explore some parts you may find on a map of the world.
Elevation is also known as the height of a location compared to sea level. It can also play a role in the climate of a region.
For example, communities living in mountainous regions experience colder temperatures than those closer to sea level.
Physical maps show the landmarks and land formations on the surface of the Earth. They also indicate the elevation of different regions on the Earth.
The higher the elevation, the colder the climate of the region.Physical maps
Physical maps are maps that are used to understand the physical environment around the world. Using these maps helps us understand how elevated or flat the land is. To illustrate the elevation, these maps are colour coded.

This is a colour coded map to understand the elevation in the different continents of the world. Starting from left to right. North America is colour coded with brown on the west coast, yellow in the middle, and green on the east coast. There Arctic regions are covered in white, with tiny bits of green and yellow. South America is colour coded with brown on the west coast, and the rest of the continent is a mixture of yellow and green. Africa is colour coded with a mixture of brown, yellow, and green. Europe is colour coded mostly with green, and with a bit of yellow towards the south coast. Asia is mostly covered in green, with some yellow and brown towards the centre of the continent. There is also a small patch of white before the south coast. Australia is colour coded with a mixture of green and yellow. Antarctica is the southern point of the Earth, and is completely covered in white. In between all of the continents, there are large and small sections of blue.
On this particular physical map, the colours have a specific description:
- brown: high elevation, mountains, and dry
- blue: water
- white: frozen ice and snow covered
- green: vegetation and/or forests
- yellow: dry and/or desert
After exploring the map, think about the following question:
- How can this map help us understand more about an early society?
Record your ideas in a notebook or a method of your choice.
Press ‘Let’s check!’ to access a possible response.
Climate and early societies

Let’s consider how the climate affected societies around the world:
Press the following tabs to access more details about climate around the world.
Climate affected the way people travel.
For example:
- In the Sahara, caravans made their way across the desert on camels.
- In the Arctic, Inuit traditionally used dogsleds.
- In Ontario, paddling canoes was the method of travel preferred by many Indigenous groups.
Climate affected the items that were traded and what was considered valuable.
For example:
- In the Mali Empire, salt held great value.
- In North America, a few Indigenous groups traded beaver pelts in the fur trade, which was made possible by wetlands and habitats that created a huge beaver population.
The types of plants that were available for use as medicine and consumption were affected by the climate.
For example, the berries that were gathered by the Cree in Ontario were a result of the climate.
The types of crops that could be grown were affected by the climate.
For example, the climate in Mexico led to the growth of corn.
The climate also played a role in the types of structures that were built.
For example, many temples in Thailand had an open concept design to allow the free flow of air, as it was extremely humid.
Brainstorm
Let’s think!
Now that we have considered the role of the climate, consider the following question:
How does the physical environment affect the way people travel, trade, grow, and build?
Record your ideas in a notebook or a method of your choice.
Press ‘Hint’ to access an additional prompt to help guide your thinking.
Consolidation
Learning check!

Let’s consider the relationship between climate, physical geography, and society.
Select the correct answer, then press ‘Check Answer’ to see how you did.
Compare and contrast

Compare and contrast the climate and physical features of two of the societies that we explored in the previous Action section.
Consider:
- What similarities do you notice between the climate and physical features of the location of these two societies?
- What are two ways climate and the physical features of a location can affect a society?
Complete the Compare & Contrast: Climate and Physical Features activity in your notebook, in the following fillable and printable document, or in a method of your choice.
Press the Activity button to access the Compare & Contrast: Climate and Physical Features.
Activity(Opens in a new tab)Reflection
As you read through these descriptions, which sentence best describes how you are feeling about your understanding of this learning activity? Press the button that is beside this sentence.
I feel...
Now, record your ideas using a voice recorder, speech-to-text, or writing tool.
Press ‘Discover More’ to extend your skills.
Discover MoreMaps and civilizations
Research using reliable websites and record where the different early civilizations were located in the world.
Use a map to label or describe where each of the following societies is located:
- Early Greece
- Early Rome
- Early India Indus Valley
- Early Egypt
- Early Aztec
- Inuit
- Early Mayan
- Medieval England
- Early China
- Haudenosaunee
- Early Mesopotamia
- Mali Empire
- Cree
- Haida Gwaii
- Mi’kmaq
Complete the Maps and Civilizations activity in your notebook, in the following printable document, or in a method of your choice.
Press the ‘Activity’ button to access Maps and Civilizations.